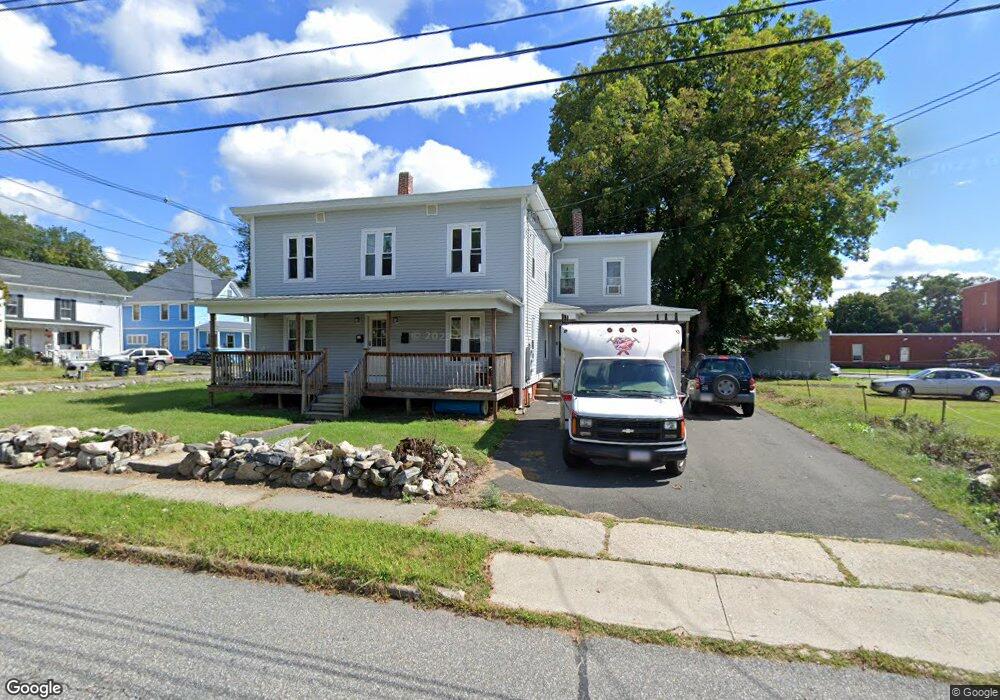
11 Knox St Unit 15 Palmer, MA 01069
Estimated Value: $325,000 - $424,000
5
Beds
3
Baths
3,072
Sq Ft
$120/Sq Ft
Est. Value
About This Home
This home is located at 11 Knox St Unit 15, Palmer, MA 01069 and is currently estimated at $368,667, approximately $120 per square foot. 11 Knox St Unit 15 is a home located in Hampden County with nearby schools including Old Mill Pond Elementary School, Converse Middle School, and Palmer High School.
Ownership History
Date
Name
Owned For
Owner Type
Purchase Details
Closed on
Jul 13, 2018
Sold by
Exr Llc
Bought by
Jms North Main Street
Current Estimated Value
Purchase Details
Closed on
Apr 11, 2018
Sold by
Hsbc Bank Usa Na
Bought by
Exr Llc
Purchase Details
Closed on
Mar 30, 2016
Sold by
Ingleman Scott Q and Hsbc Bank Usa Na
Bought by
Hsbc Bank Usa Na Tr
Purchase Details
Closed on
Mar 29, 2012
Sold by
Ingleman Scott Q
Bought by
Ingleman Scott Q and Tczin Sianshu
Purchase Details
Closed on
Jan 24, 2000
Sold by
Est Manley Florence H and Manley Howard V
Bought by
Ingleman Scott Q
Home Financials for this Owner
Home Financials are based on the most recent Mortgage that was taken out on this home.
Original Mortgage
$104,500
Interest Rate
7.84%
Mortgage Type
Purchase Money Mortgage
Create a Home Valuation Report for This Property
The Home Valuation Report is an in-depth analysis detailing your home's value as well as a comparison with similar homes in the area
Home Values in the Area
Average Home Value in this Area
Purchase History
| Date | Buyer | Sale Price | Title Company |
|---|---|---|---|
| Jms North Main Street | $44,000 | -- | |
| Exr Llc | $5,000 | -- | |
| Exr Llc | $5,000 | -- | |
| Hsbc Bank Usa Na Tr | $170,000 | -- | |
| Hsbc Bank Usa Na Tr | $170,000 | -- | |
| Ingleman Scott Q | -- | -- | |
| Ingleman Scott Q | -- | -- | |
| Ingleman Scott Q | $110,000 | -- | |
| Ingleman Scott Q | $110,000 | -- |
Source: Public Records
Mortgage History
| Date | Status | Borrower | Loan Amount |
|---|---|---|---|
| Previous Owner | Ingleman Scott Q | $104,500 |
Source: Public Records
Tax History Compared to Growth
Tax History
| Year | Tax Paid | Tax Assessment Tax Assessment Total Assessment is a certain percentage of the fair market value that is determined by local assessors to be the total taxable value of land and additions on the property. | Land | Improvement |
|---|---|---|---|---|
| 2025 | $6,100 | $336,100 | $52,200 | $283,900 |
| 2024 | $5,694 | $305,000 | $47,400 | $257,600 |
| 2023 | $5,373 | $276,400 | $47,400 | $229,000 |
| 2022 | $4,946 | $231,100 | $41,600 | $189,500 |
| 2021 | $4,435 | $196,000 | $46,200 | $149,800 |
| 2020 | $4,277 | $187,600 | $46,200 | $141,400 |
| 2019 | $3,394 | $153,300 | $46,200 | $107,100 |
| 2018 | $3,321 | $150,400 | $44,800 | $105,600 |
| 2017 | $3,244 | $150,400 | $44,800 | $105,600 |
| 2016 | $3,297 | $155,000 | $43,500 | $111,500 |
| 2015 | $3,198 | $155,000 | $43,500 | $111,500 |
Source: Public Records
Map
Nearby Homes
- 44 Converse St
- 1018-1020 Maple St
- 2034 Pleasant St
- 72 Quaboag Valley Co Op St Unit 70
- Lot 0 Thorndike and Lawrence St
- 62-91 Lawrence St
- Lots 39-42 Lawrence
- 0 St Unit 73414881
- L 65-35-1 Pine Hill Dr
- 1029 Wilson St
- 160 Breckenridge St
- 1682 N Main St
- 207 Breckenridge St
- Lot 8 Breckenridge St
- 1247 Calkins Rd
- 11 Allen St
- 15 Quaboag Valley Co-Op St Unit 15
- 268 Palmer Rd Unit 59
- 268 Palmer Rd Unit 44
- 268 Palmer Rd Unit 27