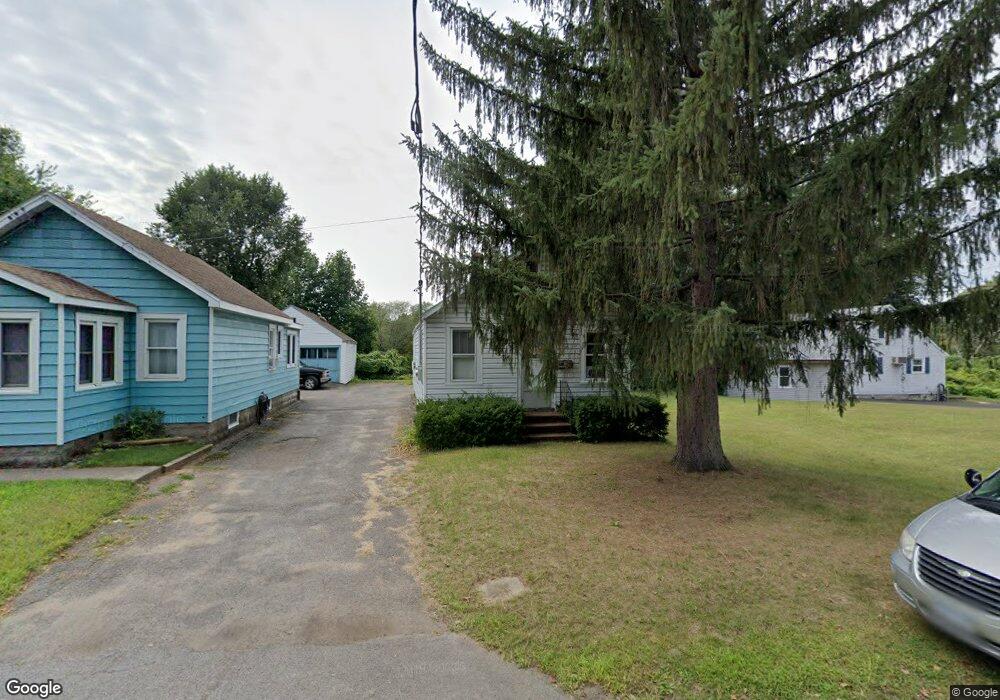
11 Laing St Albany, NY 12205
Estimated Value: $169,000 - $201,000
2
Beds
1
Bath
600
Sq Ft
$314/Sq Ft
Est. Value
About This Home
This home is located at 11 Laing St, Albany, NY 12205 and is currently estimated at $188,585, approximately $314 per square foot. 11 Laing St is a home located in Albany County with nearby schools including Roessleville School, Sand Creek Middle School, and Colonie Central High School.
Ownership History
Date
Name
Owned For
Owner Type
Purchase Details
Closed on
Feb 14, 2011
Sold by
Helinski Richard
Bought by
Helinski Christine
Current Estimated Value
Purchase Details
Closed on
Apr 16, 2010
Sold by
Helinski Richard A
Bought by
Helinski Christine M
Home Financials for this Owner
Home Financials are based on the most recent Mortgage that was taken out on this home.
Original Mortgage
$62,500
Interest Rate
4.76%
Purchase Details
Closed on
Aug 31, 2000
Sold by
Caswell Rona J
Bought by
Helinski Richard A
Create a Home Valuation Report for This Property
The Home Valuation Report is an in-depth analysis detailing your home's value as well as a comparison with similar homes in the area
Home Values in the Area
Average Home Value in this Area
Purchase History
| Date | Buyer | Sale Price | Title Company |
|---|---|---|---|
| Helinski Christine | -- | Lisa E. Brown | |
| Helinski Christine M | -- | None Available | |
| Helinski Richard A | $59,900 | Richard D Symansky |
Source: Public Records
Mortgage History
| Date | Status | Borrower | Loan Amount |
|---|---|---|---|
| Previous Owner | Helinski Christine M | $62,500 |
Source: Public Records
Tax History Compared to Growth
Tax History
| Year | Tax Paid | Tax Assessment Tax Assessment Total Assessment is a certain percentage of the fair market value that is determined by local assessors to be the total taxable value of land and additions on the property. | Land | Improvement |
|---|---|---|---|---|
| 2024 | $3,023 | $63,000 | $12,600 | $50,400 |
| 2023 | $2,968 | $63,000 | $12,600 | $50,400 |
| 2022 | $2,893 | $63,000 | $12,600 | $50,400 |
| 2021 | $2,856 | $63,000 | $12,600 | $50,400 |
| 2020 | $2,256 | $63,000 | $12,600 | $50,400 |
| 2019 | $1,324 | $63,000 | $12,600 | $50,400 |
| 2018 | $2,164 | $63,000 | $12,600 | $50,400 |
| 2017 | $0 | $63,000 | $12,600 | $50,400 |
| 2016 | $2,109 | $63,000 | $12,600 | $50,400 |
| 2015 | -- | $63,000 | $12,600 | $50,400 |
| 2014 | -- | $63,000 | $12,600 | $50,400 |
Source: Public Records
Map
Nearby Homes