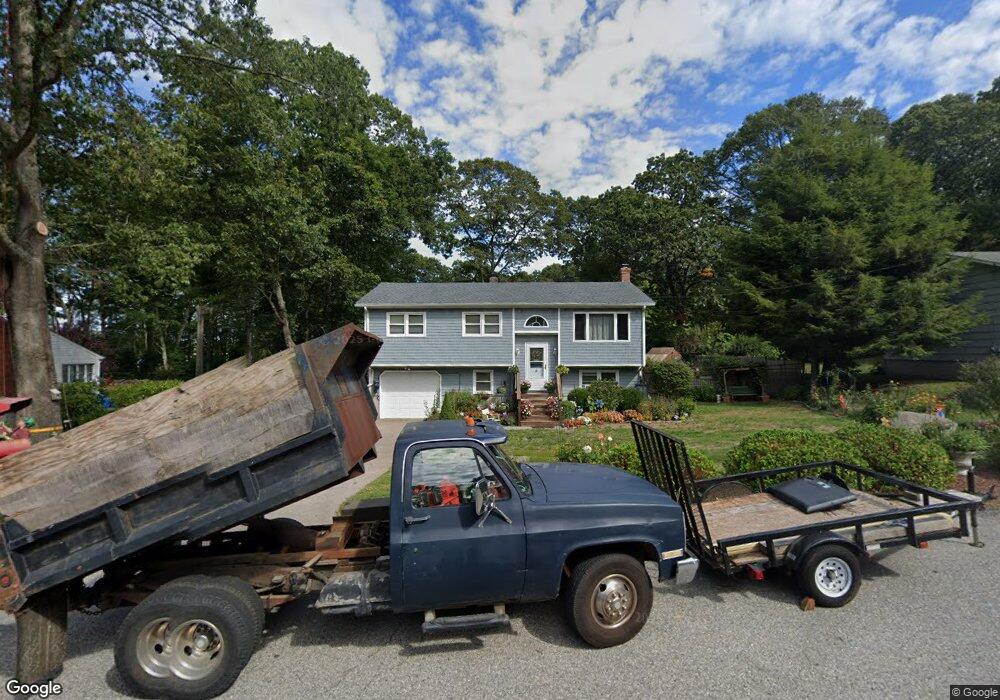
11 Lakeside Dr Westerly, RI 02891
Estimated Value: $420,612 - $546,000
3
Beds
1
Bath
1,086
Sq Ft
$450/Sq Ft
Est. Value
About This Home
This home is located at 11 Lakeside Dr, Westerly, RI 02891 and is currently estimated at $488,653, approximately $449 per square foot. 11 Lakeside Dr is a home located in Washington County with nearby schools including Westerly High School and St. Michael School.
Ownership History
Date
Name
Owned For
Owner Type
Purchase Details
Closed on
Dec 21, 2020
Sold by
Traendly Thomas and Traendly Cynthia
Bought by
Traendly Cynthia
Current Estimated Value
Purchase Details
Closed on
Apr 30, 2007
Sold by
Horton Brian S and Horton Dana M
Bought by
Traendly Thomas and Mason-Traendly Cynthia J
Home Financials for this Owner
Home Financials are based on the most recent Mortgage that was taken out on this home.
Original Mortgage
$237,500
Interest Rate
6.18%
Mortgage Type
Purchase Money Mortgage
Purchase Details
Closed on
May 18, 2004
Sold by
Tucker Ralph and Tucker Susan
Bought by
Horton Brian and Horton Dana
Home Financials for this Owner
Home Financials are based on the most recent Mortgage that was taken out on this home.
Original Mortgage
$218,500
Interest Rate
5.47%
Mortgage Type
Purchase Money Mortgage
Create a Home Valuation Report for This Property
The Home Valuation Report is an in-depth analysis detailing your home's value as well as a comparison with similar homes in the area
Home Values in the Area
Average Home Value in this Area
Purchase History
| Date | Buyer | Sale Price | Title Company |
|---|---|---|---|
| Traendly Cynthia | -- | None Available | |
| Traendly Thomas | $250,000 | -- | |
| Horton Brian | $230,000 | -- |
Source: Public Records
Mortgage History
| Date | Status | Borrower | Loan Amount |
|---|---|---|---|
| Previous Owner | Horton Brian | $226,400 | |
| Previous Owner | Horton Brian | $237,500 | |
| Previous Owner | Horton Brian | $218,500 |
Source: Public Records
Tax History
| Year | Tax Paid | Tax Assessment Tax Assessment Total Assessment is a certain percentage of the fair market value that is determined by local assessors to be the total taxable value of land and additions on the property. | Land | Improvement |
|---|---|---|---|---|
| 2025 | $2,668 | $375,200 | $162,600 | $212,600 |
| 2024 | $2,865 | $292,000 | $116,200 | $175,800 |
| 2023 | $2,809 | $292,000 | $116,200 | $175,800 |
| 2022 | $2,792 | $292,000 | $116,200 | $175,800 |
| 2021 | $2,754 | $239,100 | $101,000 | $138,100 |
| 2020 | $2,691 | $237,900 | $101,000 | $136,900 |
| 2019 | $2,664 | $237,900 | $101,000 | $136,900 |
| 2018 | $2,513 | $211,500 | $101,000 | $110,500 |
| 2017 | $2,451 | $211,500 | $101,000 | $110,500 |
| 2016 | $2,470 | $211,500 | $101,000 | $110,500 |
| 2015 | $2,312 | $213,700 | $97,700 | $116,000 |
| 2014 | $2,274 | $213,700 | $97,700 | $116,000 |
Source: Public Records
Map
Nearby Homes
- 19 Apache Dr Unit F
- 19 Apache Dr Unit 19C
- 17 Apache Dr Unit G
- 0 Iroquois Ave
- 12 Apache Dr Unit A
- 22 Colonial Dr
- 2 Marichris Dr
- 7 Schilke Dr
- 118 Dunns Corner Rd
- 12 Batterson Ave
- 5 Marion St
- 21 Linden St
- 33 Whipple Ave
- 2 Gravity Ct
- 16 Spring St
- 25 School St Unit 2
- 54 Sherwood Dr
- 19 Nichols Ln
- 55 Pleasant St
- 13 Plateau Rd
Your Personal Tour Guide
Ask me questions while you tour the home.