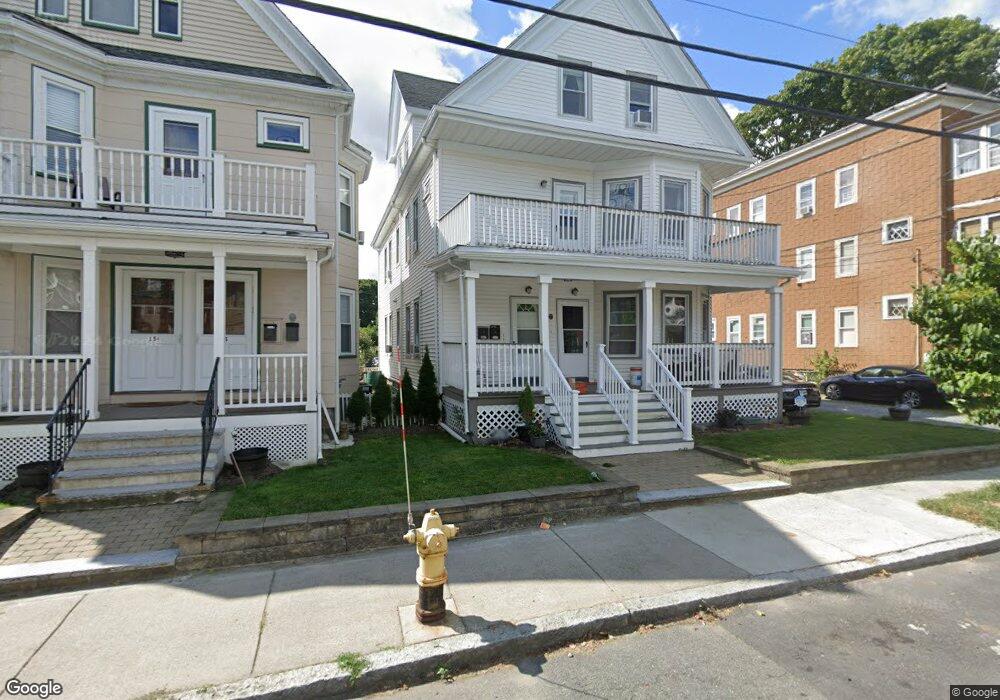
11 Lambert St Unit 2 Medford, MA 02155
Glenwood NeighborhoodEstimated Value: $1,275,364 - $1,507,000
6
Beds
3
Baths
3,143
Sq Ft
$431/Sq Ft
Est. Value
About This Home
This home is located at 11 Lambert St Unit 2, Medford, MA 02155 and is currently estimated at $1,355,091, approximately $431 per square foot. 11 Lambert St Unit 2 is a home located in Middlesex County with nearby schools including Medford High School, Mystic Valley Regional Charter School, and St. Joseph School.
Ownership History
Date
Name
Owned For
Owner Type
Purchase Details
Closed on
Aug 31, 2006
Sold by
Craig Derek J and Fobert Lauren M
Bought by
Craig Derek J and Craig Lauren M
Current Estimated Value
Home Financials for this Owner
Home Financials are based on the most recent Mortgage that was taken out on this home.
Original Mortgage
$486,000
Outstanding Balance
$294,397
Interest Rate
6.83%
Mortgage Type
Purchase Money Mortgage
Estimated Equity
$1,060,694
Purchase Details
Closed on
Aug 5, 2005
Sold by
Reardon Rita A
Bought by
Craig Derek J and Fobert Lauren M
Home Financials for this Owner
Home Financials are based on the most recent Mortgage that was taken out on this home.
Original Mortgage
$382,400
Interest Rate
5.63%
Mortgage Type
Purchase Money Mortgage
Create a Home Valuation Report for This Property
The Home Valuation Report is an in-depth analysis detailing your home's value as well as a comparison with similar homes in the area
Home Values in the Area
Average Home Value in this Area
Purchase History
| Date | Buyer | Sale Price | Title Company |
|---|---|---|---|
| Craig Derek J | -- | -- | |
| Craig Derek J | $478,000 | -- |
Source: Public Records
Mortgage History
| Date | Status | Borrower | Loan Amount |
|---|---|---|---|
| Open | Craig Derek J | $486,000 | |
| Previous Owner | Craig Derek J | $382,400 |
Source: Public Records
Tax History Compared to Growth
Tax History
| Year | Tax Paid | Tax Assessment Tax Assessment Total Assessment is a certain percentage of the fair market value that is determined by local assessors to be the total taxable value of land and additions on the property. | Land | Improvement |
|---|---|---|---|---|
| 2025 | $9,489 | $1,078,300 | $371,900 | $706,400 |
| 2024 | $8,717 | $1,023,100 | $354,200 | $668,900 |
| 2023 | $8,547 | $988,100 | $331,000 | $657,100 |
| 2022 | $8,632 | $958,000 | $300,900 | $657,100 |
| 2021 | $8,086 | $859,300 | $286,600 | $572,700 |
| 2020 | $7,967 | $867,900 | $286,600 | $581,300 |
| 2019 | $7,586 | $790,200 | $260,500 | $529,700 |
| 2018 | $7,200 | $703,100 | $236,800 | $466,300 |
| 2017 | $6,740 | $638,300 | $221,300 | $417,000 |
| 2016 | $6,576 | $587,700 | $201,200 | $386,500 |
| 2015 | $5,851 | $500,100 | $191,600 | $308,500 |
Source: Public Records
Map
Nearby Homes
- 16 Walker St Unit 16
- 15 Walker St Unit 4
- 32 Almont St Unit 32-1
- 124 Grant Ave
- 70 Tainter St
- 70 Tainter St Unit 1
- 500 Salem St Unit 708
- 68 Central Ave Unit 306
- 0 Fells Avenue Terrace
- 77 Rock Glen Rd
- 179 Park St Unit 201
- 83 Court St
- 26 Saint Mary St
- 14 Tainter St Unit 2
- 53 Sheridan Ave
- 240 Salem St Unit 3C
- 10 Lewis St
- 10 Lewis St Unit 2
- 10 Lewis St Unit 1
- 159 Central Ave Unit 159
- 11 Lambert St
- 7 Lambert St
- 7 Lambert St Unit 7
- 9 Lambert St
- 7 Lambert St Unit 1
- 13 Lambert St Unit 13 Lambert St
- 13 Lambert St Unit 2
- 15 Lambert St
- 15 Lambert St Unit 1
- 1 Lambert St Unit 1
- 33 Cherry St
- 12 Lambert St
- 29 Cherry St
- 8 Lambert St
- 17 Lambert St
- 170 Sheridan Ave
- 170 Sheridan Ave Unit 1
- 16 Lambert St
- 14 Lambert St Unit 2
- 172 Sheridan Ave Unit 2