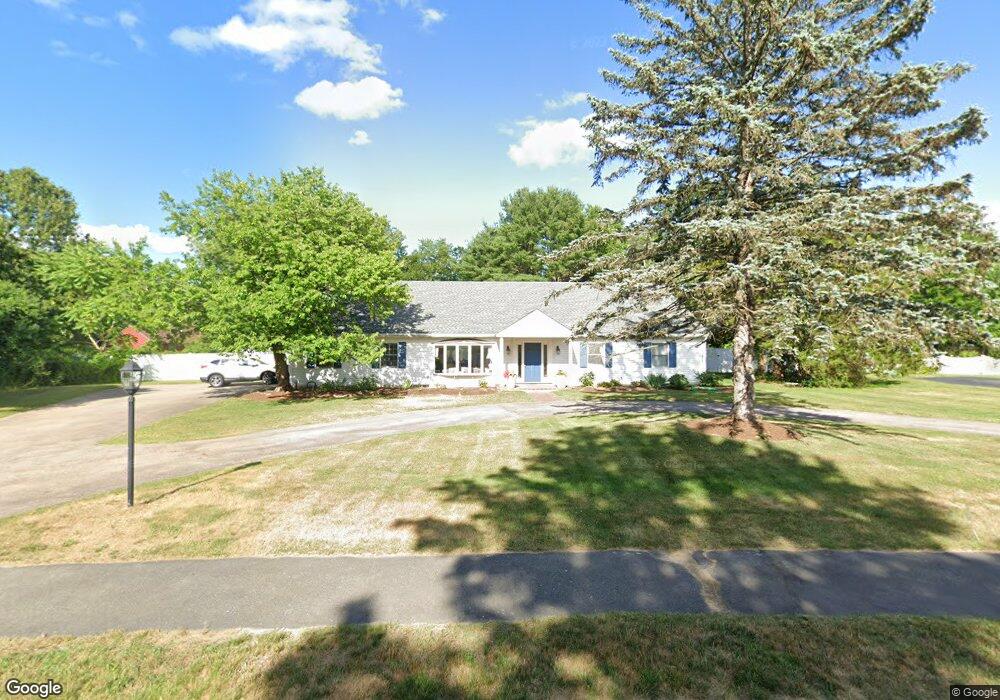
11 Langdon Rd Natick, MA 01760
Estimated Value: $1,011,720 - $1,120,000
3
Beds
3
Baths
2,100
Sq Ft
$506/Sq Ft
Est. Value
About This Home
This home is located at 11 Langdon Rd, Natick, MA 01760 and is currently estimated at $1,063,430, approximately $506 per square foot. 11 Langdon Rd is a home located in Middlesex County with nearby schools including Natick High School, Bennett-Hemenway (Ben-Hem) Elementary School, and Wilson Middle School.
Ownership History
Date
Name
Owned For
Owner Type
Purchase Details
Closed on
Dec 7, 2021
Sold by
Abrahams Linda E
Bought by
Linda E Abrahams 2021 Ret
Current Estimated Value
Purchase Details
Closed on
Dec 8, 2005
Sold by
Garnick Roberta M
Bought by
Abrahams Linda E
Home Financials for this Owner
Home Financials are based on the most recent Mortgage that was taken out on this home.
Original Mortgage
$472,000
Interest Rate
6.17%
Mortgage Type
Purchase Money Mortgage
Create a Home Valuation Report for This Property
The Home Valuation Report is an in-depth analysis detailing your home's value as well as a comparison with similar homes in the area
Home Values in the Area
Average Home Value in this Area
Purchase History
| Date | Buyer | Sale Price | Title Company |
|---|---|---|---|
| Linda E Abrahams 2021 Ret | -- | None Available | |
| Abrahams Linda E | $590,000 | -- |
Source: Public Records
Mortgage History
| Date | Status | Borrower | Loan Amount |
|---|---|---|---|
| Previous Owner | Abrahams Linda E | $472,000 |
Source: Public Records
Tax History
| Year | Tax Paid | Tax Assessment Tax Assessment Total Assessment is a certain percentage of the fair market value that is determined by local assessors to be the total taxable value of land and additions on the property. | Land | Improvement |
|---|---|---|---|---|
| 2025 | $9,916 | $829,100 | $485,000 | $344,100 |
| 2024 | $9,657 | $787,700 | $456,300 | $331,400 |
| 2023 | $9,360 | $740,500 | $433,700 | $306,800 |
| 2022 | $9,049 | $678,300 | $389,400 | $288,900 |
| 2021 | $8,388 | $616,300 | $367,200 | $249,100 |
| 2020 | $8,161 | $599,600 | $350,500 | $249,100 |
| 2019 | $7,621 | $599,600 | $350,500 | $249,100 |
| 2018 | $7,325 | $561,300 | $333,800 | $227,500 |
| 2017 | $6,804 | $504,400 | $267,500 | $236,900 |
| 2016 | $6,283 | $463,000 | $248,600 | $214,400 |
| 2015 | $6,133 | $443,800 | $248,600 | $195,200 |
Source: Public Records
Map
Nearby Homes
Your Personal Tour Guide
Ask me questions while you tour the home.