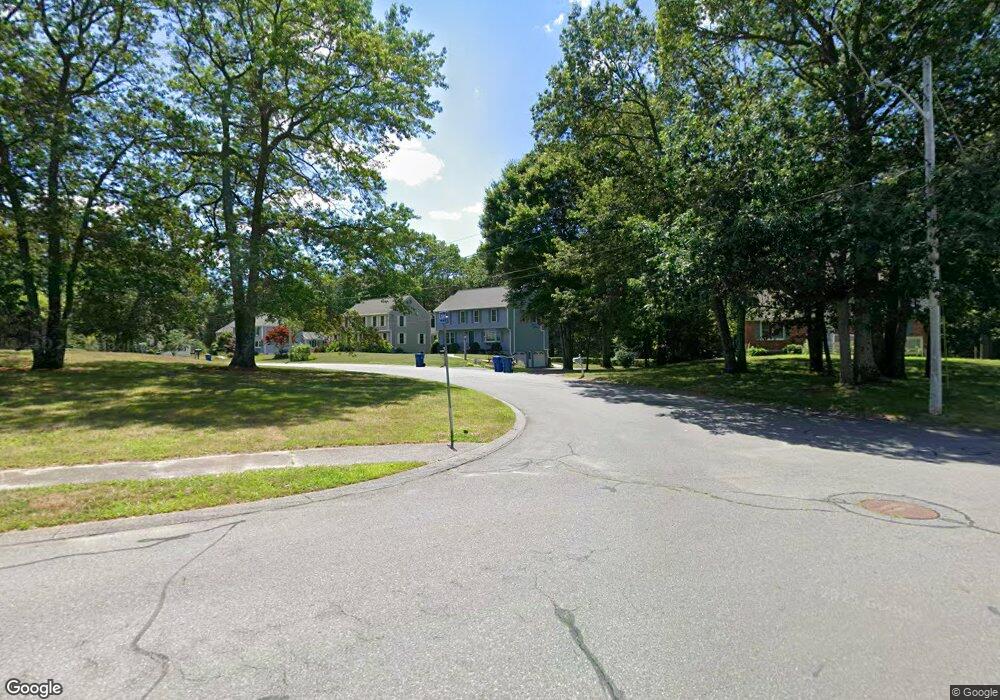
11 Langley Ln Tewksbury, MA 01876
Estimated Value: $797,160 - $858,000
4
Beds
3
Baths
2,160
Sq Ft
$377/Sq Ft
Est. Value
About This Home
This home is located at 11 Langley Ln, Tewksbury, MA 01876 and is currently estimated at $814,790, approximately $377 per square foot. 11 Langley Ln is a home located in Middlesex County with nearby schools including Lowell Community Charter Public School.
Ownership History
Date
Name
Owned For
Owner Type
Purchase Details
Closed on
Feb 15, 2013
Sold by
Hannula David J and Hannula Evelyn J
Bought by
Hannula Ft
Current Estimated Value
Purchase Details
Closed on
Aug 3, 1987
Sold by
Hills Mor Const Co
Bought by
Hannula David J
Home Financials for this Owner
Home Financials are based on the most recent Mortgage that was taken out on this home.
Original Mortgage
$95,000
Interest Rate
10.43%
Mortgage Type
Purchase Money Mortgage
Create a Home Valuation Report for This Property
The Home Valuation Report is an in-depth analysis detailing your home's value as well as a comparison with similar homes in the area
Home Values in the Area
Average Home Value in this Area
Purchase History
| Date | Buyer | Sale Price | Title Company |
|---|---|---|---|
| Hannula Ft | -- | -- | |
| Hannula David J | $230,900 | -- |
Source: Public Records
Mortgage History
| Date | Status | Borrower | Loan Amount |
|---|---|---|---|
| Previous Owner | Hannula David J | $19,000 | |
| Previous Owner | Hannula David J | $110,000 | |
| Previous Owner | Hannula David J | $42,000 | |
| Previous Owner | Hannula David J | $95,000 |
Source: Public Records
Tax History Compared to Growth
Tax History
| Year | Tax Paid | Tax Assessment Tax Assessment Total Assessment is a certain percentage of the fair market value that is determined by local assessors to be the total taxable value of land and additions on the property. | Land | Improvement |
|---|---|---|---|---|
| 2025 | $9,335 | $706,100 | $336,400 | $369,700 |
| 2024 | $9,132 | $682,000 | $320,400 | $361,600 |
| 2023 | $8,664 | $614,500 | $291,600 | $322,900 |
| 2022 | $8,193 | $539,000 | $253,500 | $285,500 |
| 2021 | $7,978 | $507,500 | $230,500 | $277,000 |
| 2020 | $7,864 | $492,400 | $219,500 | $272,900 |
| 2019 | $7,233 | $456,600 | $208,900 | $247,700 |
| 2018 | $7,262 | $424,600 | $208,900 | $215,700 |
| 2017 | $10,648 | $421,000 | $208,900 | $212,100 |
| 2016 | $6,600 | $403,700 | $208,900 | $194,800 |
| 2015 | $6,484 | $396,100 | $208,900 | $187,200 |
| 2014 | $6,341 | $393,600 | $217,500 | $176,100 |
Source: Public Records
Map
Nearby Homes
- 9 Laurie Ann Ln
- 167 Charles Dr
- 30 Mckenna Dr Unit 30
- 160 Booth St
- 189 Lakeview St
- 221 Shoreline Dr
- 214 Shoreline Dr
- 0 Fitzpatrick Ln
- 31 Wells Dr
- 11 Park Ave
- 18 Jaclyn's Way Unit 18
- 80 Sesame St
- 28 Greenwood Ave
- 101 Squire Ln
- 164 Astle St
- 72 N Billerica Rd
- 296 Astle St
- 38-40 Talbot Ave
- 48 Old Elm St
- 4 Strand St
- 21 Langley Ln
- 1 Langley Ln
- 1556 E 66th Ave
- 31 Langley Ln
- 10 Langley Ln
- 20 Langley Ln
- 41 Langley Ln
- 30 Langley Ln
- 51 Langley Ln
- 11 Wellington Cir
- 50 Langley Ln
- 21 Wellington Cir
- 61 Langley Ln
- 12 Hardwood Dr
- 31 Wellington Cir
- 10 Hardwood Dr
- 71 Langley Ln
- 14 Hardwood Dr
- 10 Wescott Cir
- 41 Wellington Cir