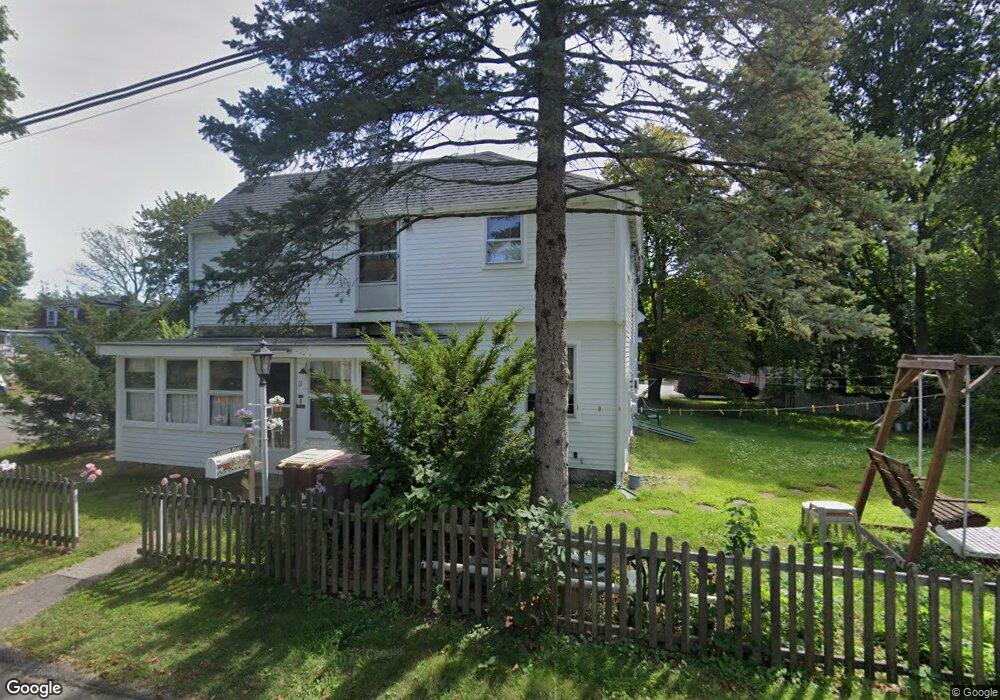
11 Linden Place East Weymouth, MA 02189
East Weymouth NeighborhoodEstimated Value: $600,000 - $649,000
3
Beds
2
Baths
1,722
Sq Ft
$361/Sq Ft
Est. Value
About This Home
This home is located at 11 Linden Place, East Weymouth, MA 02189 and is currently estimated at $621,459, approximately $360 per square foot. 11 Linden Place is a home located in Norfolk County with nearby schools including Abigail Adams Middle School, Academy Avenue Elementary School, and Weymouth Middle School Chapman.
Ownership History
Date
Name
Owned For
Owner Type
Purchase Details
Closed on
Feb 6, 2008
Sold by
Baulis Eileen T and Baulis Eleanor M
Bought by
Blue Sky Rt
Current Estimated Value
Purchase Details
Closed on
Jun 15, 1990
Sold by
Sebell Jeffrey
Bought by
Grimes Michael
Home Financials for this Owner
Home Financials are based on the most recent Mortgage that was taken out on this home.
Original Mortgage
$180,000
Interest Rate
10.54%
Mortgage Type
Purchase Money Mortgage
Create a Home Valuation Report for This Property
The Home Valuation Report is an in-depth analysis detailing your home's value as well as a comparison with similar homes in the area
Home Values in the Area
Average Home Value in this Area
Purchase History
| Date | Buyer | Sale Price | Title Company |
|---|---|---|---|
| Blue Sky Rt | -- | -- | |
| Grimes Michael | $225,000 | -- |
Source: Public Records
Mortgage History
| Date | Status | Borrower | Loan Amount |
|---|---|---|---|
| Previous Owner | Grimes Michael | $180,000 |
Source: Public Records
Tax History Compared to Growth
Tax History
| Year | Tax Paid | Tax Assessment Tax Assessment Total Assessment is a certain percentage of the fair market value that is determined by local assessors to be the total taxable value of land and additions on the property. | Land | Improvement |
|---|---|---|---|---|
| 2025 | $5,012 | $496,200 | $199,400 | $296,800 |
| 2024 | $4,860 | $473,200 | $189,900 | $283,300 |
| 2023 | $4,831 | $462,300 | $175,800 | $286,500 |
| 2022 | $4,712 | $411,200 | $162,800 | $248,400 |
| 2021 | $4,385 | $373,500 | $162,800 | $210,700 |
| 2020 | $4,213 | $353,400 | $162,800 | $190,600 |
| 2019 | $4,116 | $339,600 | $156,600 | $183,000 |
| 2018 | $3,994 | $319,500 | $149,100 | $170,400 |
| 2017 | $3,819 | $298,100 | $142,000 | $156,100 |
| 2016 | $3,671 | $286,800 | $136,600 | $150,200 |
| 2015 | $3,627 | $281,200 | $136,600 | $144,600 |
| 2014 | $3,542 | $266,300 | $127,100 | $139,200 |
Source: Public Records
Map
Nearby Homes
- 56 Putnam St
- 575 Broad St Unit 305
- 575 Broad St Unit 215
- 29-31 Broad Street Place
- 303 Middle St
- 209 Lake St Unit 69
- 425 East St
- 17 Grove St
- 30 Puritan Rd
- 38 School St Unit 2
- 1297 Pleasant St
- 145 Jaffrey St
- 42 Sundin Rd
- 20 Richards Rd
- 286 Essex St
- 367 Essex St
- 449 Middle St
- 669 Commercial St
- 12 Klasson Ln
- 2 Winstead Rd
- 15 Cain Ave
- 9 Cain Ave
- 8 Linden Place
- 14 Linden Place
- 4 Linden Place
- 21 Linden Place
- 618 Broad St
- 25-27 Cain Ave
- 12 Cain Ave Unit 12
- 10 Cain Ave Unit 12
- 34 Lafayette Ave
- 16 Cain Ave
- 3 Laurel St
- 30 Lafayette Ave
- 10-12 Cain Ave Unit 10-12
- 25 Cain Ave Unit 27
- 28 Lafayette Ave
- 590 Broad St
- 592 Broad St Unit 592
- 35 Cain Ave