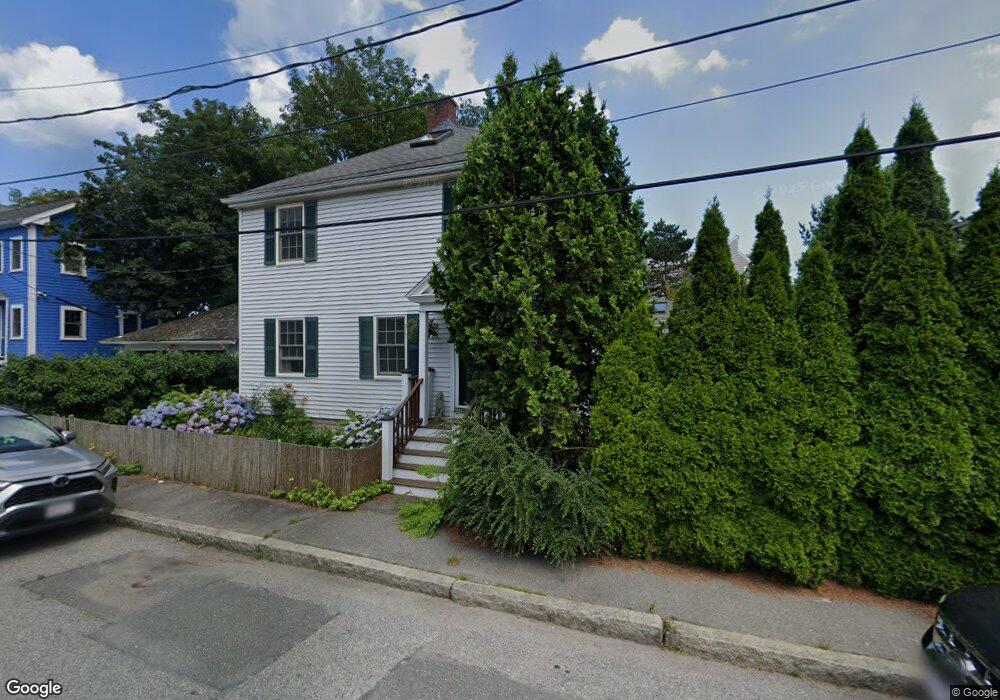
11 Lindsey St Marblehead, MA 01945
Estimated Value: $1,035,519 - $1,449,000
4
Beds
3
Baths
2,496
Sq Ft
$498/Sq Ft
Est. Value
About This Home
This home is located at 11 Lindsey St, Marblehead, MA 01945 and is currently estimated at $1,243,130, approximately $498 per square foot. 11 Lindsey St is a home located in Essex County with nearby schools including Marblehead High School, Marblehead Community Charter Public School, and Devereux School.
Ownership History
Date
Name
Owned For
Owner Type
Purchase Details
Closed on
Nov 9, 1995
Sold by
Tyler Lillian I and Poor Susan A
Bought by
Poor Susan A
Current Estimated Value
Home Financials for this Owner
Home Financials are based on the most recent Mortgage that was taken out on this home.
Original Mortgage
$158,400
Outstanding Balance
$2,220
Interest Rate
7.62%
Mortgage Type
Purchase Money Mortgage
Estimated Equity
$1,240,910
Create a Home Valuation Report for This Property
The Home Valuation Report is an in-depth analysis detailing your home's value as well as a comparison with similar homes in the area
Home Values in the Area
Average Home Value in this Area
Purchase History
| Date | Buyer | Sale Price | Title Company |
|---|---|---|---|
| Poor Susan A | $176,000 | -- | |
| Poor Susan A | $176,000 | -- |
Source: Public Records
Mortgage History
| Date | Status | Borrower | Loan Amount |
|---|---|---|---|
| Open | Poor Susan A | $70,800 | |
| Open | Poor Susan A | $158,400 | |
| Closed | Poor Susan A | $158,400 |
Source: Public Records
Tax History Compared to Growth
Tax History
| Year | Tax Paid | Tax Assessment Tax Assessment Total Assessment is a certain percentage of the fair market value that is determined by local assessors to be the total taxable value of land and additions on the property. | Land | Improvement |
|---|---|---|---|---|
| 2025 | $8,025 | $886,700 | $560,000 | $326,700 |
| 2024 | $8,335 | $930,300 | $609,800 | $320,500 |
| 2023 | $7,370 | $737,000 | $472,900 | $264,100 |
| 2022 | $6,946 | $660,300 | $404,400 | $255,900 |
| 2021 | $6,405 | $614,700 | $360,900 | $253,800 |
| 2020 | $6,653 | $640,300 | $410,700 | $229,600 |
| 2019 | $6,208 | $578,000 | $348,400 | $229,600 |
| 2018 | $6,233 | $565,600 | $336,000 | $229,600 |
| 2017 | $5,953 | $540,700 | $311,100 | $229,600 |
| 2016 | $5,725 | $515,800 | $286,200 | $229,600 |
| 2015 | $5,578 | $503,400 | $273,800 | $229,600 |
| 2014 | $5,239 | $472,400 | $248,900 | $223,500 |
Source: Public Records
Map
Nearby Homes
- 15 Lindsey St
- 9 Skinner's Path Unit 9
- 2 Lindsey St
- 60 Gregory St Unit 3
- 33 Waldron St
- 41 Atlantic Ave Unit 1
- 290 Washington St Unit 3
- 290 Washington St Unit 2
- 290 Washington St Unit 1
- 9 Darling St
- 41 Rowland St
- 45 Pleasant St
- 134 Elm St
- 132 Elm St
- 132 Elm St Unit 132
- 19 Linden St
- 12 Heritage Way Unit 12
- 29 Village St Unit 1
- 95 Front St Unit 5
- 1 Green St Unit 2
- 5 Lindsey St
- 13 Lindsey St
- 47 Gregory St
- 49 Gregory St
- 4R Lindsey St
- 8 Lindsey St
- 45 Gregory St
- 54 Hawkes St
- 54 Hawkes St Unit 1
- 10 Lindsey St
- 51 Gregory St
- 53 Gregory St Unit A
- 4 Lindsey St
- 43 Gregory St
- 6 Lindsey St
- 17 Lindsey St Unit 17
- 12 Lindsey St Unit 16
- 50 Hawkes St
- 41 Gregory St
- 48 Hawkes St