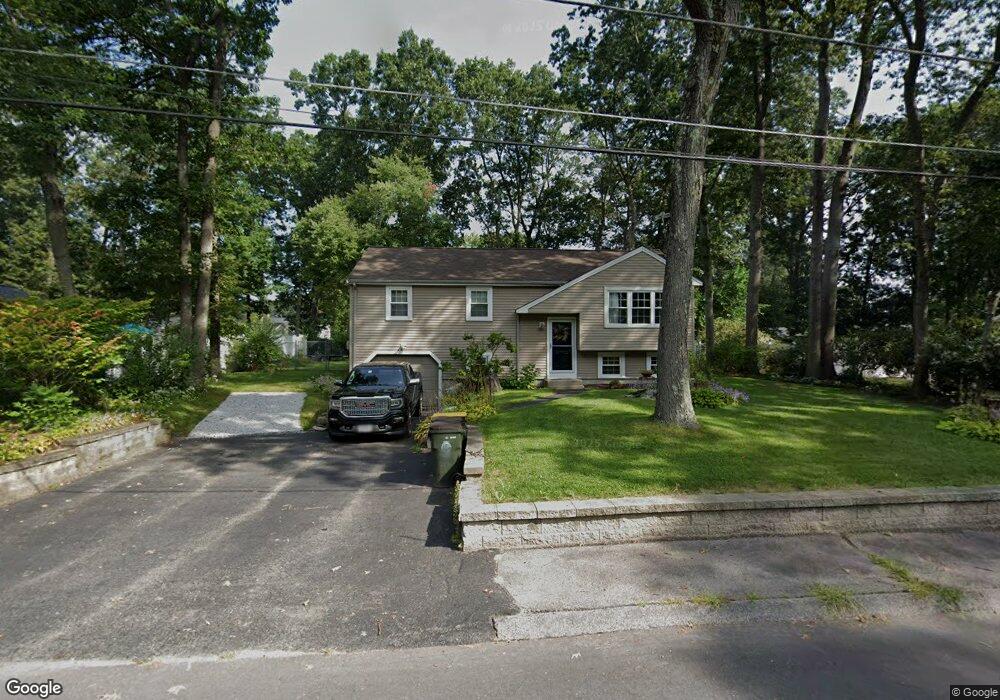
11 Little Tree Ln Bellingham, MA 02019
Estimated Value: $468,000 - $533,000
3
Beds
1
Bath
1,338
Sq Ft
$372/Sq Ft
Est. Value
About This Home
This home is located at 11 Little Tree Ln, Bellingham, MA 02019 and is currently estimated at $497,972, approximately $372 per square foot. 11 Little Tree Ln is a home located in Norfolk County with nearby schools including Joseph F. DiPietro Elementary, Bellingham High School, and Rise Prep Mayoral Academy Middle School.
Ownership History
Date
Name
Owned For
Owner Type
Purchase Details
Closed on
Sep 29, 2000
Sold by
Chaisson Michael F
Bought by
Ledden David J
Current Estimated Value
Home Financials for this Owner
Home Financials are based on the most recent Mortgage that was taken out on this home.
Original Mortgage
$312,560
Outstanding Balance
$114,150
Interest Rate
7.94%
Mortgage Type
Purchase Money Mortgage
Estimated Equity
$383,822
Purchase Details
Closed on
Feb 3, 2000
Sold by
Summer Milford Rt
Bought by
Chaisson Michael F
Purchase Details
Closed on
Nov 18, 1999
Sold by
Sullivan Tr Owen
Bought by
Chaisson Michael F
Purchase Details
Closed on
Sep 28, 1992
Sold by
Drake Michael R and Drake Kathryn J
Bought by
Mercier Kenneth J and Mercier Carol A
Purchase Details
Closed on
Jun 16, 1992
Sold by
Resolution Trust Corp
Bought by
Drake Mihcael R and Drake Kathryn J
Create a Home Valuation Report for This Property
The Home Valuation Report is an in-depth analysis detailing your home's value as well as a comparison with similar homes in the area
Home Values in the Area
Average Home Value in this Area
Purchase History
| Date | Buyer | Sale Price | Title Company |
|---|---|---|---|
| Ledden David J | $390,700 | -- | |
| Chaisson Michael F | $125,000 | -- | |
| Chaisson Michael F | $125,000 | -- | |
| Mercier Kenneth J | $120,900 | -- | |
| Mercier Kenneth J | $120,900 | -- | |
| Drake Mihcael R | $180,000 | -- | |
| Drake Mihcael R | $180,000 | -- |
Source: Public Records
Mortgage History
| Date | Status | Borrower | Loan Amount |
|---|---|---|---|
| Open | Drake Mihcael R | $169,400 | |
| Open | Drake Mihcael R | $312,560 |
Source: Public Records
Tax History Compared to Growth
Tax History
| Year | Tax Paid | Tax Assessment Tax Assessment Total Assessment is a certain percentage of the fair market value that is determined by local assessors to be the total taxable value of land and additions on the property. | Land | Improvement |
|---|---|---|---|---|
| 2025 | $5,135 | $408,800 | $166,200 | $242,600 |
| 2024 | $4,922 | $382,700 | $151,700 | $231,000 |
| 2023 | $4,745 | $363,600 | $144,500 | $219,100 |
| 2022 | $4,621 | $328,200 | $120,500 | $207,700 |
| 2021 | $4,492 | $311,700 | $120,500 | $191,200 |
| 2020 | $4,283 | $301,200 | $120,500 | $180,700 |
| 2019 | $4,191 | $294,900 | $120,500 | $174,400 |
| 2018 | $3,853 | $267,400 | $115,900 | $151,500 |
| 2017 | $3,748 | $261,400 | $115,900 | $145,500 |
| 2016 | $3,574 | $250,100 | $113,900 | $136,200 |
| 2015 | $3,426 | $240,400 | $109,500 | $130,900 |
| 2014 | $3,432 | $234,100 | $107,000 | $127,100 |
Source: Public Records
Map
Nearby Homes
- 9 Little Tree Ln
- 13 Little Tree Ln
- 8 Little Tree Ln
- 10 Little Tree Ln
- 15 Little Tree Ln
- 7 Little Tree Ln
- 18 Laurel Ln
- 22 Laurel Ln
- 6 Little Tree Ln
- 12 Little Tree Ln
- 14 Laurel Ln
- 26 Laurel Ln
- 17 Little Tree Ln
- 5 Little Tree Ln
- 14 Little Tree Ln
- 30 Laurel Ln
- 19 Little Tree Ln
- 16 Little Tree Ln
- 530 S Main St
- 21 Laurel Ln