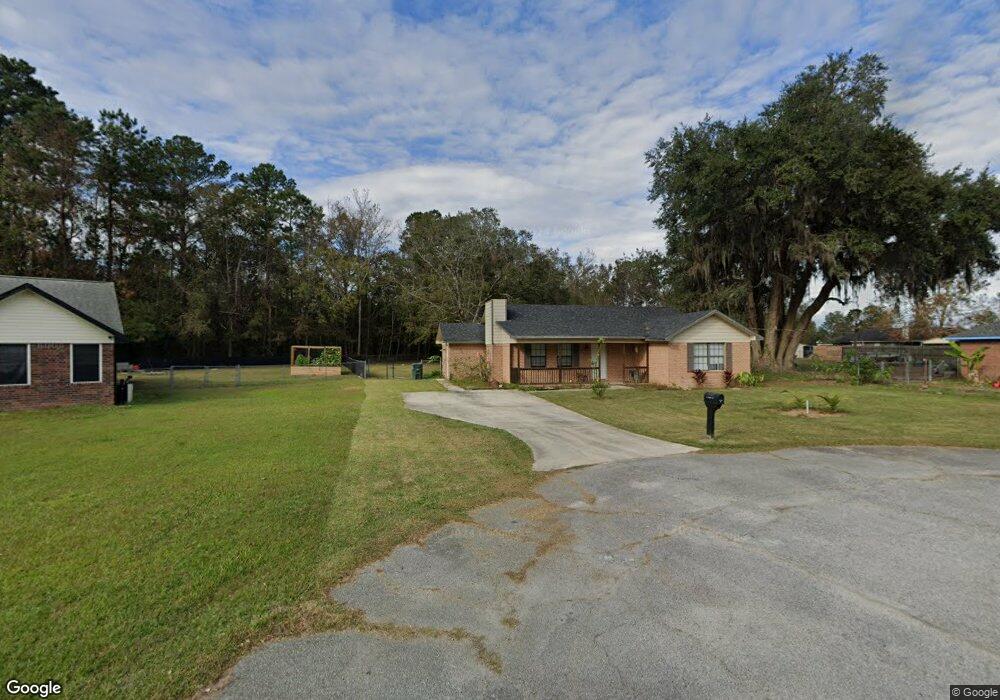
11 Logan Ct Midway, GA 31320
Estimated Value: $226,000 - $253,081
3
Beds
2
Baths
1,479
Sq Ft
$161/Sq Ft
Est. Value
About This Home
This home is located at 11 Logan Ct, Midway, GA 31320 and is currently estimated at $237,770, approximately $160 per square foot. 11 Logan Ct is a home located in Liberty County with nearby schools including Liberty Elementary School, Midway Middle School, and Liberty County High School.
Ownership History
Date
Name
Owned For
Owner Type
Purchase Details
Closed on
Jul 9, 2020
Sold by
Dal Umer Farooq
Bought by
Laxmi Maa Rental Llc
Current Estimated Value
Home Financials for this Owner
Home Financials are based on the most recent Mortgage that was taken out on this home.
Original Mortgage
$10,000,000
Outstanding Balance
$7,993,815
Interest Rate
3.2%
Mortgage Type
Commercial
Estimated Equity
-$7,756,045
Purchase Details
Closed on
Nov 20, 2019
Sold by
Williams Etwendal Devon
Bought by
Dal Umer Farooq
Purchase Details
Closed on
Dec 8, 2005
Sold by
Dal Umer Farooq
Bought by
Williams Etwendal Devon
Purchase Details
Closed on
Dec 6, 2005
Sold by
Hiefner James L
Bought by
Dal Umer Farooq
Purchase Details
Closed on
Jun 28, 1996
Sold by
Davis Dale E and Davis Dawn
Bought by
Hiefner James L and Sheri Lea
Purchase Details
Closed on
Jan 31, 1994
Bought by
Davis Dale E and Davis Dawn M
Purchase Details
Closed on
Sep 1, 1993
Bought by
Mccumber Construction
Create a Home Valuation Report for This Property
The Home Valuation Report is an in-depth analysis detailing your home's value as well as a comparison with similar homes in the area
Home Values in the Area
Average Home Value in this Area
Purchase History
| Date | Buyer | Sale Price | Title Company |
|---|---|---|---|
| Laxmi Maa Rental Llc | $65,000 | -- | |
| Dal Umer Farooq | -- | -- | |
| Williams Etwendal Devon | -- | -- | |
| Dal Umer Farooq | $115,900 | -- | |
| Hiefner James L | $76,900 | -- | |
| Davis Dale E | $68,000 | -- | |
| Mccumber Construction | $8,500 | -- |
Source: Public Records
Mortgage History
| Date | Status | Borrower | Loan Amount |
|---|---|---|---|
| Open | Laxmi Maa Rental Llc | $10,000,000 | |
| Closed | Williams Etwendal Devon | $0 |
Source: Public Records
Tax History Compared to Growth
Tax History
| Year | Tax Paid | Tax Assessment Tax Assessment Total Assessment is a certain percentage of the fair market value that is determined by local assessors to be the total taxable value of land and additions on the property. | Land | Improvement |
|---|---|---|---|---|
| 2024 | $3,250 | $77,622 | $12,000 | $65,622 |
| 2023 | $3,250 | $69,703 | $12,000 | $57,703 |
| 2022 | $2,266 | $57,568 | $11,200 | $46,368 |
| 2021 | $1,171 | $52,640 | $11,200 | $41,440 |
| 2020 | $1,669 | $42,123 | $10,000 | $32,123 |
| 2019 | $1,759 | $42,547 | $10,000 | $32,547 |
| 2018 | $1,756 | $42,970 | $10,000 | $32,970 |
| 2017 | $1,538 | $46,710 | $10,000 | $36,710 |
| 2016 | $1,674 | $43,822 | $10,000 | $33,822 |
| 2015 | $1,757 | $43,822 | $10,000 | $33,822 |
| 2014 | $1,757 | $45,727 | $10,000 | $35,727 |
| 2013 | -- | $42,451 | $10,000 | $32,451 |
Source: Public Records
Map
Nearby Homes
- 9 Ashlynn Ln
- 124 Denham Ln
- 124 Denham Ln
- 0 E Oglethorpe Unit 10592168
- 0 E Oglethorpe Unit SA333651
- 0 E Oglethorpe Unit 153327
- 10 Katelynn Ln
- 266 River Bend Dr
- 327 River Bend Dr
- 90 Charleston Ct
- 0000 E Oglethorpe Hwy
- 182 Gloucester Dr
- 1123 Stone Ct
- 984 Stone Ct
- 0 S Coastal Hwy
- 175 U S 17
- 1979 S Coastal Hwy
- 140 Kettle Creek Ln
- 307 Cottage Loop
- 177 Cottage Loop
- 19 Logan Ct
- 205 Cross Creek Dr
- 0 Cross Creek Dr Unit 7225047
- 0 Cross Creek Dr
- 187 Cross Creek Dr
- 251 Cross Creek Dr
- 224 Cross Creek Dr
- 204 Cross Creek Dr
- 60 Ashlynn Ln
- 50 Ashlynn Ln
- 250 Cross Creek Dr
- 277 Cross Creek Dr
- 186 Cross Creek Dr
- 16 Ashlynn Ln
- 166 Cross Creek Dr
- 286 Cross Creek Dr
- 70 Cross Creek Dr
- 37 Cross Creek Dr
- 28 Cross Creek Dr
- 27 Cross Creek Dr