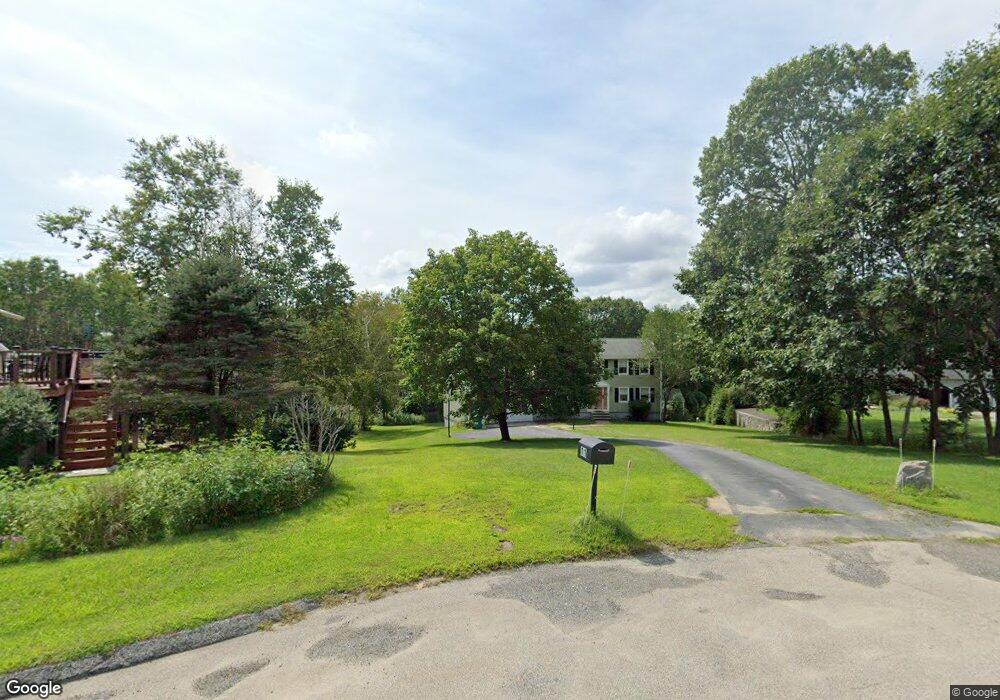
11 Longview Ave Webster, MA 01570
Estimated Value: $514,044 - $585,000
3
Beds
3
Baths
2,090
Sq Ft
$260/Sq Ft
Est. Value
About This Home
This home is located at 11 Longview Ave, Webster, MA 01570 and is currently estimated at $543,261, approximately $259 per square foot. 11 Longview Ave is a home located in Worcester County with nearby schools including Park Avenue Elementary School, Webster Middle School, and Bartlett High School.
Ownership History
Date
Name
Owned For
Owner Type
Purchase Details
Closed on
Aug 27, 1997
Sold by
Miller Kenneth S and Miller Michelle J
Bought by
Jasmin Michel H and Jasmin Allyson M
Current Estimated Value
Purchase Details
Closed on
Apr 2, 1993
Sold by
Ward Construction Co
Bought by
Miller Kenneth S and Miller Michele
Create a Home Valuation Report for This Property
The Home Valuation Report is an in-depth analysis detailing your home's value as well as a comparison with similar homes in the area
Home Values in the Area
Average Home Value in this Area
Purchase History
| Date | Buyer | Sale Price | Title Company |
|---|---|---|---|
| Jasmin Michel H | $175,000 | -- | |
| Miller Kenneth S | $154,900 | -- |
Source: Public Records
Mortgage History
| Date | Status | Borrower | Loan Amount |
|---|---|---|---|
| Open | Miller Kenneth S | $283,500 | |
| Closed | Miller Kenneth S | $80,000 | |
| Closed | Miller Kenneth S | $172,250 |
Source: Public Records
Tax History
| Year | Tax Paid | Tax Assessment Tax Assessment Total Assessment is a certain percentage of the fair market value that is determined by local assessors to be the total taxable value of land and additions on the property. | Land | Improvement |
|---|---|---|---|---|
| 2025 | $4,870 | $409,900 | $74,200 | $335,700 |
| 2024 | $4,804 | $394,400 | $71,400 | $323,000 |
| 2023 | $4,396 | $351,700 | $68,000 | $283,700 |
| 2022 | $4,301 | $308,100 | $66,000 | $242,100 |
| 2021 | $4,291 | $284,200 | $66,000 | $218,200 |
| 2020 | $3,272 | $281,600 | $66,000 | $215,600 |
| 2019 | $4,059 | $264,800 | $66,600 | $198,200 |
| 2018 | $2,957 | $260,200 | $66,600 | $193,600 |
| 2017 | $3,781 | $249,900 | $65,200 | $184,700 |
| 2016 | $3,531 | $233,200 | $62,200 | $171,000 |
| 2015 | $3,388 | $230,800 | $61,000 | $169,800 |
Source: Public Records
Map
Nearby Homes
- 16 Hilltop Dr
- 171 Upper Gore Rd
- 24 Cooper Rd
- 26 Wakefield Ave
- 13 S Point Rd
- 3 Upper Gore Rd
- 117 New Rd
- 27 Douglas Rd
- 23 Lakeview Rd
- 121 New Rd
- 53-55 Point Pleasant Rd
- 10 Indian Point Rd
- 60 Webster St
- 149 A Gore Rd
- 0 Thompson Rd
- 125 Birch Island Rd
- 110 Minebrook Rd
- 597 E Thompson Rd Unit Lot 10C
- 98 Minebrook Rd
- 0 Porter Plain Rd
- 13 Longview Ave
- 9 Longview Ave
- 15 Longview Ave
- 5 Longview Ave
- 16 Longview Ave
- 199 Lower Gore Rd
- 209 Lower Gore Rd
- 272 Lower Gore Rd
- 6 Longview Ave
- 202 Lower Gore Rd
- 198 Lower Gore Rd
- 200 Lower Gore Rd
- 195 Lower Gore Rd
- 195 Lower Gore Rd Unit 1
- 206 Lower Gore Rd
- 10 Longview Ave
- 204 Lower Gore Rd
- 4 Longview Ave
- 194 Lower Gore Rd
- 191 Lower Gore Rd
Your Personal Tour Guide
Ask me questions while you tour the home.