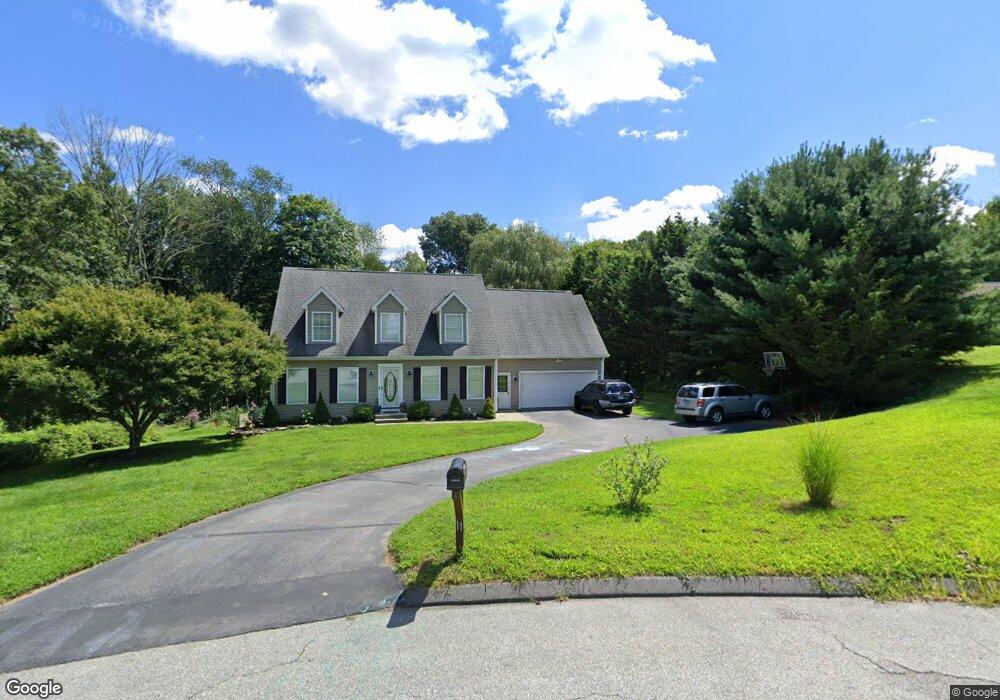
11 Lorrie Anne Dr Oakdale, CT 06370
Estimated Value: $514,412 - $607,000
3
Beds
3
Baths
2,385
Sq Ft
$237/Sq Ft
Est. Value
About This Home
This home is located at 11 Lorrie Anne Dr, Oakdale, CT 06370 and is currently estimated at $566,103, approximately $237 per square foot. 11 Lorrie Anne Dr is a home located in New London County with nearby schools including Leonard J. Tyl Middle School, Montville High School, and Wildwood Christian School.
Ownership History
Date
Name
Owned For
Owner Type
Purchase Details
Closed on
Jan 14, 2021
Sold by
Chapman Donald R and Chapman Denise R
Bought by
Chapman Jeremy R
Current Estimated Value
Home Financials for this Owner
Home Financials are based on the most recent Mortgage that was taken out on this home.
Original Mortgage
$168,000
Outstanding Balance
$149,941
Interest Rate
2.71%
Mortgage Type
Purchase Money Mortgage
Estimated Equity
$416,162
Purchase Details
Closed on
Mar 27, 2006
Sold by
Greenwood Kenneth and Greenwood Trudy
Bought by
Chapman Donald and Chapman Denise
Home Financials for this Owner
Home Financials are based on the most recent Mortgage that was taken out on this home.
Original Mortgage
$218,000
Interest Rate
5.5%
Create a Home Valuation Report for This Property
The Home Valuation Report is an in-depth analysis detailing your home's value as well as a comparison with similar homes in the area
Home Values in the Area
Average Home Value in this Area
Purchase History
| Date | Buyer | Sale Price | Title Company |
|---|---|---|---|
| Chapman Jeremy R | $340,000 | None Available | |
| Chapman Jeremy R | $340,000 | None Available | |
| Chapman Donald | $358,000 | -- | |
| Chapman Donald | $358,000 | -- |
Source: Public Records
Mortgage History
| Date | Status | Borrower | Loan Amount |
|---|---|---|---|
| Open | Chapman Jeremy R | $168,000 | |
| Closed | Chapman Jeremy R | $168,000 | |
| Previous Owner | Chapman Donald | $211,600 | |
| Previous Owner | Chapman Donald | $218,000 |
Source: Public Records
Tax History Compared to Growth
Tax History
| Year | Tax Paid | Tax Assessment Tax Assessment Total Assessment is a certain percentage of the fair market value that is determined by local assessors to be the total taxable value of land and additions on the property. | Land | Improvement |
|---|---|---|---|---|
| 2025 | $7,732 | $267,820 | $42,000 | $225,820 |
| 2024 | $7,437 | $267,820 | $42,000 | $225,820 |
| 2023 | $7,437 | $267,820 | $42,000 | $225,820 |
| 2022 | $7,153 | $267,820 | $42,000 | $225,820 |
| 2021 | $7,012 | $220,840 | $41,710 | $179,130 |
| 2020 | $7,151 | $220,840 | $41,710 | $179,130 |
| 2019 | $7,180 | $220,840 | $41,710 | $179,130 |
| 2018 | $7,007 | $220,840 | $41,710 | $179,130 |
| 2017 | $7,001 | $220,840 | $41,710 | $179,130 |
| 2016 | $7,265 | $237,340 | $53,190 | $184,150 |
| 2015 | $7,265 | $237,340 | $53,190 | $184,150 |
| 2014 | $6,971 | $237,340 | $53,190 | $184,150 |
Source: Public Records
Map
Nearby Homes
- 89 Norwich Salem Turnpike
- 135 Noble Hill Rd
- 80 Walker Rd
- 0 Old Salem Rd Unit N10056613
- 346 Salem Turnpike
- 7 Trading Cove Cir
- 9 Trading Cove Cir
- 271 Leffingwell Rd Unit LOT 12
- 636 Connecticut 163
- 26 Darling Crossing
- 79 Briar Hill Rd
- 67 Briar Hill Rd
- 63 Velgouse Rd
- 73 Briar Ln Unit 73
- 240 Laura Blvd
- 215 Wawecus Hill Rd
- 1399 Route 163
- 123 Sheraton Ln Unit 123
- 118 Sheraton Ln
- 13 Lost Acres Rd
- 5 Lorrie Anne Dr
- 10 Lorrie Anne Dr
- 6 Lorrie Anne Dr
- 88 Cherry Ln
- 100 Cherry Ln
- 30 Norwich Salem Turnpike
- 73 Cherry Ln
- 65 Cherry Ln
- 60 Cherry Ln
- 46 Norwich Salem Turnpike
- 5 Noble Hill Rd
- 54 Cherry Ln
- 49 Cherry Ln
- 42 Route 82 A K A Norwich-Salem Turnpike
- 42 Route 82 A K A Norwich-Salem Turnpike
- 19 Ventura Dr
- 53 Cherry Ln
- 23 Ventura Dr
- 36 Route 82
- 15 Ventura Dr