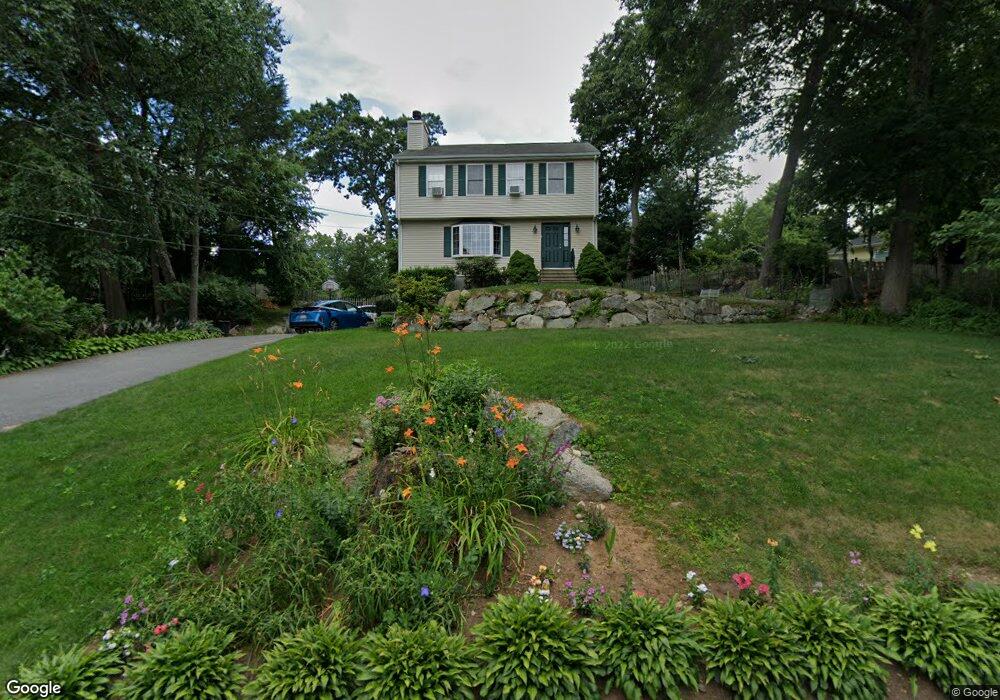
11 Lotus Path Natick, MA 01760
Estimated Value: $826,000 - $919,000
3
Beds
3
Baths
1,590
Sq Ft
$560/Sq Ft
Est. Value
About This Home
This home is located at 11 Lotus Path, Natick, MA 01760 and is currently estimated at $890,984, approximately $560 per square foot. 11 Lotus Path is a home located in Middlesex County with nearby schools including Natick High School, Bennett-Hemenway (Ben-Hem) Elementary School, and Wilson Middle School.
Ownership History
Date
Name
Owned For
Owner Type
Purchase Details
Closed on
Jun 29, 2006
Sold by
Kelleher Arthur V and Kelleher Pamela K
Bought by
Hong Chenglan and Zheng Hongjun
Current Estimated Value
Purchase Details
Closed on
Jun 26, 2000
Sold by
Yee Ardley and Yee Susie
Bought by
Kelleher Arthur V and Archabal Pamela K
Purchase Details
Closed on
Oct 8, 1997
Sold by
Barr James C and Barr Anna M
Bought by
Yee Ardley and Yee Susie
Purchase Details
Closed on
Jul 11, 1997
Sold by
Parker Kenneth V and Parker Louise B
Bought by
Barr James C and Barr Anna M
Create a Home Valuation Report for This Property
The Home Valuation Report is an in-depth analysis detailing your home's value as well as a comparison with similar homes in the area
Home Values in the Area
Average Home Value in this Area
Purchase History
| Date | Buyer | Sale Price | Title Company |
|---|---|---|---|
| Hong Chenglan | $485,000 | -- | |
| Kelleher Arthur V | $310,000 | -- | |
| Yee Ardley | $232,000 | -- | |
| Barr James C | $75,000 | -- |
Source: Public Records
Mortgage History
| Date | Status | Borrower | Loan Amount |
|---|---|---|---|
| Open | Barr James C | $310,000 | |
| Closed | Barr James C | $320,000 | |
| Closed | Barr James C | $350,000 |
Source: Public Records
Tax History
| Year | Tax Paid | Tax Assessment Tax Assessment Total Assessment is a certain percentage of the fair market value that is determined by local assessors to be the total taxable value of land and additions on the property. | Land | Improvement |
|---|---|---|---|---|
| 2025 | $9,279 | $775,800 | $436,300 | $339,500 |
| 2024 | $8,995 | $733,700 | $410,600 | $323,100 |
| 2023 | $8,699 | $688,200 | $394,200 | $294,000 |
| 2022 | $8,538 | $640,000 | $357,400 | $282,600 |
| 2021 | $8,173 | $600,500 | $337,000 | $263,500 |
| 2020 | $7,965 | $585,200 | $321,700 | $263,500 |
| 2019 | $7,438 | $585,200 | $321,700 | $263,500 |
| 2018 | $6,907 | $529,300 | $306,400 | $222,900 |
| 2017 | $6,499 | $481,800 | $263,000 | $218,800 |
| 2016 | $6,226 | $458,800 | $242,000 | $216,800 |
| 2015 | $6,090 | $440,700 | $242,000 | $198,700 |
Source: Public Records
Map
Nearby Homes
- 136 Commonwealth Rd
- 3 Ferndale Rd
- 14 Ferndale Rd
- 4 Richard Rd
- 293 Bacon St Unit A
- 29 Irving Rd
- 35 Snake Brook Rd
- 25 Irving Rd
- 8 Liberty St
- 7 Jackson Ct Unit B
- 2 Melville Place
- 186 Main St
- 10 Nouvelle Way Unit 803
- 40 Nouvelle Way Unit 441
- 27 2nd St
- 56 Fisher St
- 43 Charles St
- 41 Charles St
- 16 Arlington Rd
- 57 Beverly Rd