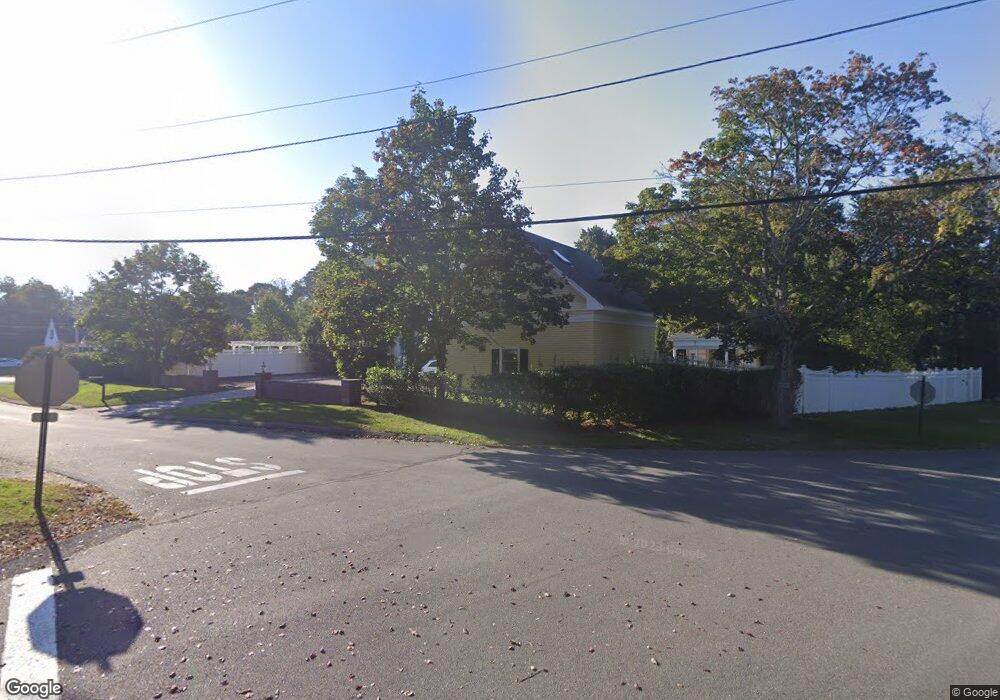
11 Lunt St Byfield, MA 01922
Estimated Value: $1,518,000 - $2,261,000
5
Beds
6
Baths
8,378
Sq Ft
$226/Sq Ft
Est. Value
About This Home
This home is located at 11 Lunt St, Byfield, MA 01922 and is currently estimated at $1,889,441, approximately $225 per square foot. 11 Lunt St is a home with nearby schools including Triton Regional High School.
Ownership History
Date
Name
Owned For
Owner Type
Purchase Details
Closed on
Jul 22, 2013
Sold by
Newbury Town Of
Bought by
Horan Christopher J and Horan Denisse Y
Current Estimated Value
Home Financials for this Owner
Home Financials are based on the most recent Mortgage that was taken out on this home.
Original Mortgage
$635,000
Outstanding Balance
$469,019
Interest Rate
3.92%
Mortgage Type
Purchase Money Mortgage
Estimated Equity
$1,420,422
Create a Home Valuation Report for This Property
The Home Valuation Report is an in-depth analysis detailing your home's value as well as a comparison with similar homes in the area
Home Values in the Area
Average Home Value in this Area
Purchase History
| Date | Buyer | Sale Price | Title Company |
|---|---|---|---|
| Horan Christopher J | $125,000 | -- | |
| Horan Christopher J | $125,000 | -- |
Source: Public Records
Mortgage History
| Date | Status | Borrower | Loan Amount |
|---|---|---|---|
| Open | Horan Christopher J | $635,000 | |
| Closed | Horan Christopher J | $635,000 |
Source: Public Records
Tax History Compared to Growth
Tax History
| Year | Tax Paid | Tax Assessment Tax Assessment Total Assessment is a certain percentage of the fair market value that is determined by local assessors to be the total taxable value of land and additions on the property. | Land | Improvement |
|---|---|---|---|---|
| 2025 | $14,679 | $1,970,400 | $266,900 | $1,703,500 |
| 2024 | $14,680 | $1,911,400 | $266,900 | $1,644,500 |
| 2023 | $15,322 | $1,767,300 | $266,900 | $1,500,400 |
| 2022 | $14,954 | $1,536,900 | $225,800 | $1,311,100 |
| 2021 | $14,640 | $1,373,400 | $184,800 | $1,188,600 |
| 2020 | $14,460 | $1,315,700 | $174,500 | $1,141,200 |
| 2019 | $12,263 | $1,134,400 | $174,500 | $959,900 |
| 2018 | $11,307 | $1,037,300 | $143,700 | $893,600 |
| 2017 | $7,110 | $670,100 | $143,700 | $526,400 |
| 2016 | $7,431 | $651,800 | $143,700 | $508,100 |
| 2015 | $7,307 | $634,300 | $133,400 | $500,900 |
| 2014 | -- | $408,100 | $133,400 | $274,700 |
Source: Public Records
Map
Nearby Homes
- 15 Central St
- 18 Forest St
- 6 Parker River Dr
- 34 Central St
- 30 Forest St
- 21 Main St
- 15 Knobb Hill
- 55 Pearson Dr Unit 9 - ALDER
- 55 Pearson Dr Unit 6-Dogwood
- 55 Pearson Dr Unit 3 - ALDER
- 55 Pearson Dr Unit 8-Dogwood
- 66 Parish Rd Unit 4
- 4 Swanton Way
- 10 Noyes Rd
- 5 Charles St
- 111 Moulton St
- 66 3 Parish Rd
- 103 Central St
- 66 2 Parish Rd
- 137 Indian Hill St