11 Lyman St Worcester, MA 01603
Hadwen Park NeighborhoodEstimated Value: $732,000 - $944,000
9
Beds
4
Baths
4,842
Sq Ft
$172/Sq Ft
Est. Value
About This Home
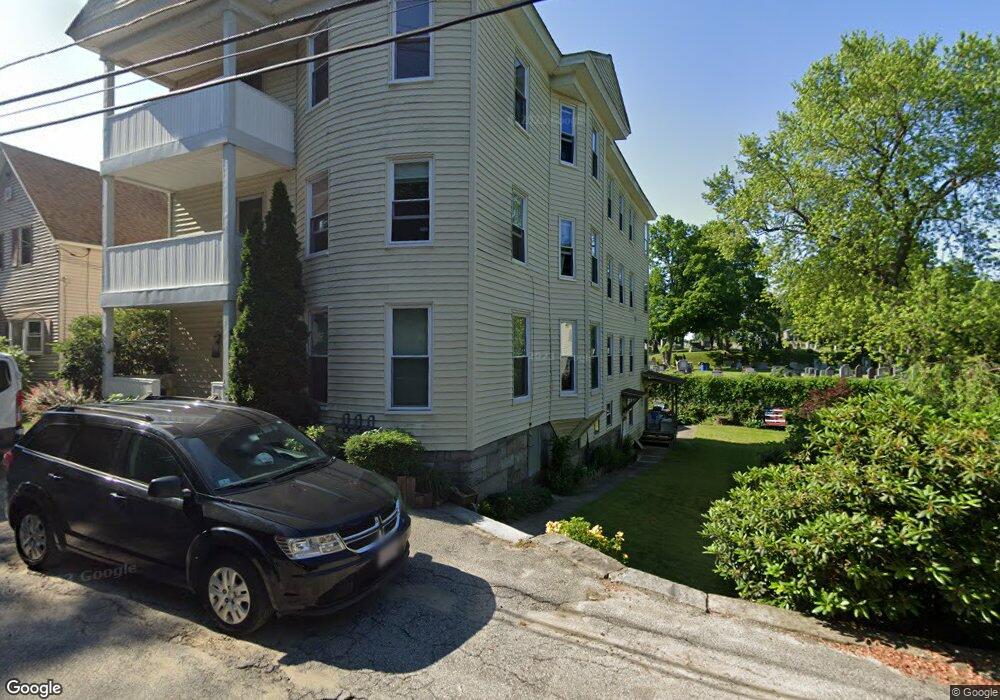
This home is located at 11 Lyman St, Worcester, MA 01603 and is currently estimated at $832,667, approximately $171 per square foot. 11 Lyman St is a home located in Worcester County with nearby schools including Gates Lane, Jacob Hiatt Magnet School, and Chandler Magnet.
Ownership History
Date
Name
Owned For
Owner Type
Purchase Details
Closed on
Mar 4, 2002
Sold by
Torrey Richard A
Bought by
Torrey Ann L and Carrier Deborah A
Current Estimated Value
Home Financials for this Owner
Home Financials are based on the most recent Mortgage that was taken out on this home.
Original Mortgage
$97,500
Interest Rate
6.85%
Mortgage Type
Purchase Money Mortgage
Create a Home Valuation Report for This Property
The Home Valuation Report is an in-depth analysis detailing your home's value as well as a comparison with similar homes in the area
Home Values in the Area
Average Home Value in this Area
Purchase History
| Date | Buyer | Sale Price | Title Company |
|---|---|---|---|
| Torrey Ann L | $130,000 | -- |
Source: Public Records
Mortgage History
| Date | Status | Borrower | Loan Amount |
|---|---|---|---|
| Open | Torrey Ann L | $110,000 | |
| Closed | Torrey Ann L | $97,500 |
Source: Public Records
Tax History Compared to Growth
Tax History
| Year | Tax Paid | Tax Assessment Tax Assessment Total Assessment is a certain percentage of the fair market value that is determined by local assessors to be the total taxable value of land and additions on the property. | Land | Improvement |
|---|---|---|---|---|
| 2025 | $7,117 | $539,600 | $76,800 | $462,800 |
| 2024 | $6,560 | $477,100 | $76,800 | $400,300 |
| 2023 | $6,212 | $433,200 | $61,600 | $371,600 |
| 2022 | $5,412 | $355,800 | $49,300 | $306,500 |
| 2021 | $5,233 | $332,600 | $39,400 | $293,200 |
| 2020 | $4,979 | $292,900 | $39,600 | $253,300 |
| 2019 | $5,060 | $281,100 | $39,000 | $242,100 |
| 2018 | $4,741 | $250,700 | $39,000 | $211,700 |
| 2017 | $4,442 | $231,100 | $39,000 | $192,100 |
| 2016 | $4,324 | $209,800 | $31,200 | $178,600 |
| 2015 | $4,211 | $209,800 | $31,200 | $178,600 |
| 2014 | $4,099 | $209,800 | $31,200 | $178,600 |
Source: Public Records
Map
Nearby Homes
- 24 Meena Dr
- 3 Arbor Vitae St
- 27 Haynes St
- 26 Haynes St Unit 1
- 11 Montague St
- 40 Lakewood St
- 141 Cambridge St
- 21 Hitchcock Rd
- 160 Fremont St Unit 239
- 160 Fremont St Unit 204
- 22 Baker St
- 12 Stoneland Rd
- 29 Wayne St
- 5 Stoneland Rd
- 4 S Edlin St
- 56 Richards St
- 54 Richards St
- 1022 Main St
- 52 Richards St
- 114 Henshaw St