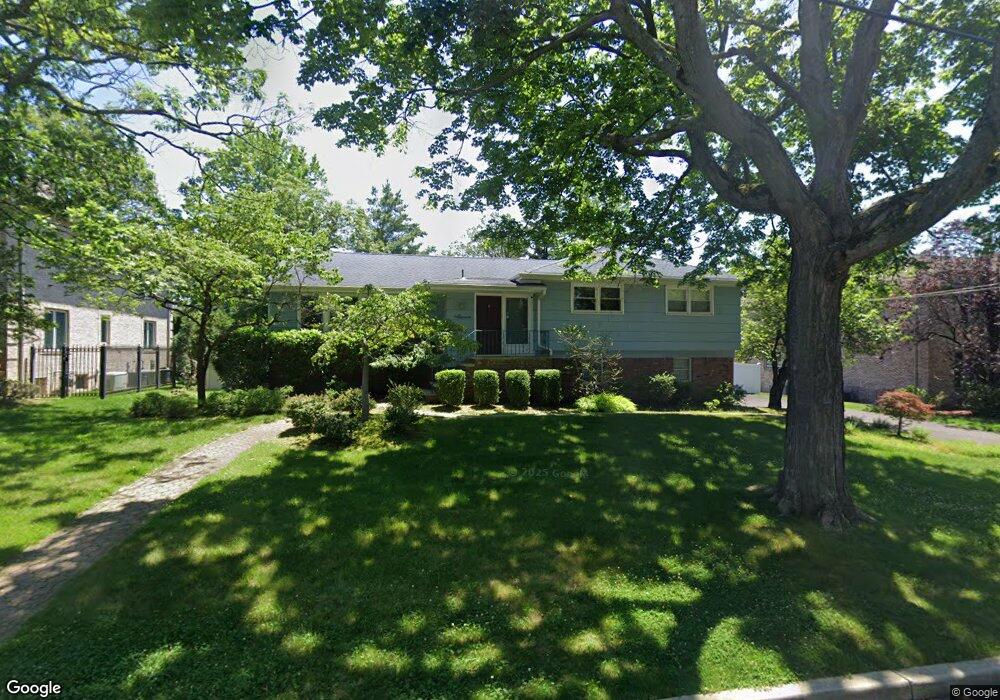
11 Lynn Dr Englewood Cliffs, NJ 07632
Estimated Value: $1,589,839 - $1,965,000
--
Bed
--
Bath
2,344
Sq Ft
$769/Sq Ft
Est. Value
About This Home
This home is located at 11 Lynn Dr, Englewood Cliffs, NJ 07632 and is currently estimated at $1,802,460, approximately $768 per square foot. 11 Lynn Dr is a home located in Bergen County with nearby schools including North Cliff Elementary School, Upper School Elementary School, and Englewood on the Palisades Charter School.
Ownership History
Date
Name
Owned For
Owner Type
Purchase Details
Closed on
Oct 26, 2023
Sold by
Oh Francis and Oh Xu
Bought by
Oh Family Trust and Oh
Current Estimated Value
Purchase Details
Closed on
May 15, 2014
Sold by
Beit Halachmy David and Beit Halachmy Nili
Bought by
Oh Francis and Zhang Xu
Home Financials for this Owner
Home Financials are based on the most recent Mortgage that was taken out on this home.
Original Mortgage
$580,000
Interest Rate
3.37%
Mortgage Type
New Conventional
Create a Home Valuation Report for This Property
The Home Valuation Report is an in-depth analysis detailing your home's value as well as a comparison with similar homes in the area
Home Values in the Area
Average Home Value in this Area
Purchase History
| Date | Buyer | Sale Price | Title Company |
|---|---|---|---|
| Oh Family Trust | -- | None Listed On Document | |
| Oh Francis | $1,230,000 | -- |
Source: Public Records
Mortgage History
| Date | Status | Borrower | Loan Amount |
|---|---|---|---|
| Previous Owner | Oh Francis | $580,000 |
Source: Public Records
Tax History Compared to Growth
Tax History
| Year | Tax Paid | Tax Assessment Tax Assessment Total Assessment is a certain percentage of the fair market value that is determined by local assessors to be the total taxable value of land and additions on the property. | Land | Improvement |
|---|---|---|---|---|
| 2025 | $14,365 | $1,243,700 | $1,065,300 | $178,400 |
| 2024 | $14,191 | $1,243,700 | $1,065,300 | $178,400 |
| 2023 | $13,967 | $1,243,700 | $1,065,300 | $178,400 |
| 2022 | $13,967 | $1,243,700 | $1,065,300 | $178,400 |
| 2021 | $10,737 | $1,243,700 | $1,065,300 | $178,400 |
| 2020 | $14,315 | $1,243,700 | $1,065,300 | $178,400 |
| 2019 | $13,444 | $1,243,700 | $1,065,300 | $178,400 |
| 2018 | $12,972 | $1,243,700 | $1,065,300 | $178,400 |
| 2017 | $12,412 | $1,243,700 | $1,065,300 | $178,400 |
| 2016 | $12,176 | $1,243,700 | $1,065,300 | $178,400 |
| 2015 | $11,566 | $1,243,700 | $1,065,300 | $178,400 |
| 2014 | $10,302 | $1,184,100 | $1,065,300 | $118,800 |
Source: Public Records
Map
Nearby Homes