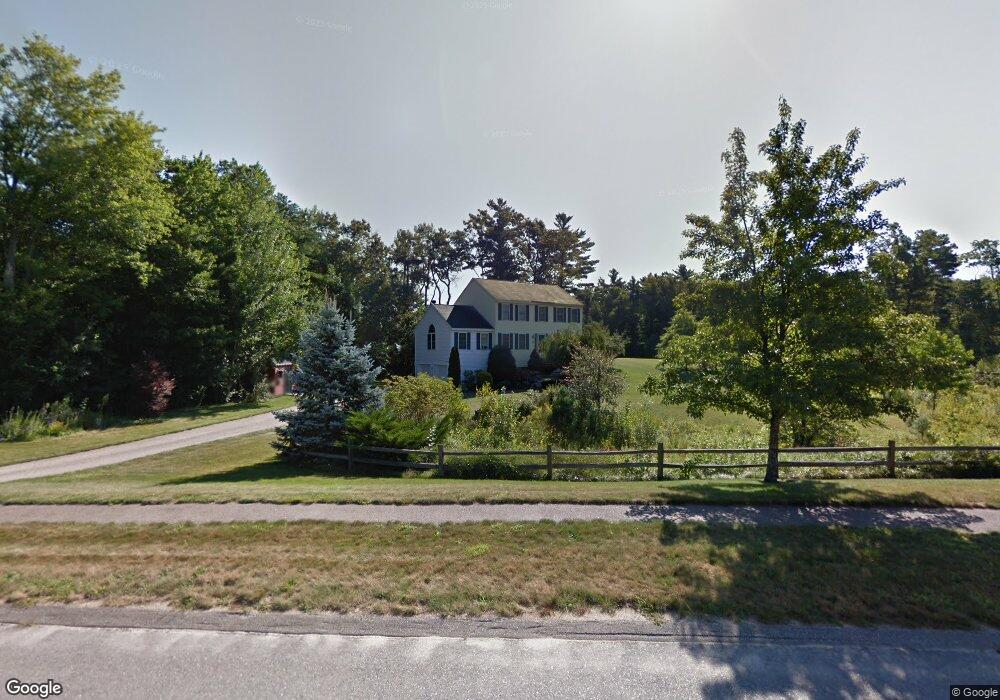
11 Lynnwood Dr Rutland, MA 01543
Estimated Value: $595,397 - $630,000
3
Beds
3
Baths
2,116
Sq Ft
$291/Sq Ft
Est. Value
About This Home
This home is located at 11 Lynnwood Dr, Rutland, MA 01543 and is currently estimated at $615,349, approximately $290 per square foot. 11 Lynnwood Dr is a home located in Worcester County with nearby schools including Wachusett Regional High School.
Ownership History
Date
Name
Owned For
Owner Type
Purchase Details
Closed on
Nov 9, 1999
Sold by
Deer Run Inc
Bought by
Borseth Ralph and Borseth Sharon
Current Estimated Value
Home Financials for this Owner
Home Financials are based on the most recent Mortgage that was taken out on this home.
Original Mortgage
$177,849
Interest Rate
7.73%
Mortgage Type
Purchase Money Mortgage
Create a Home Valuation Report for This Property
The Home Valuation Report is an in-depth analysis detailing your home's value as well as a comparison with similar homes in the area
Home Values in the Area
Average Home Value in this Area
Purchase History
| Date | Buyer | Sale Price | Title Company |
|---|---|---|---|
| Borseth Ralph | $197,610 | -- |
Source: Public Records
Mortgage History
| Date | Status | Borrower | Loan Amount |
|---|---|---|---|
| Open | Borseth Ralph | $175,000 | |
| Closed | Borseth Ralph | $177,849 |
Source: Public Records
Tax History Compared to Growth
Tax History
| Year | Tax Paid | Tax Assessment Tax Assessment Total Assessment is a certain percentage of the fair market value that is determined by local assessors to be the total taxable value of land and additions on the property. | Land | Improvement |
|---|---|---|---|---|
| 2025 | $6,747 | $473,800 | $97,500 | $376,300 |
| 2024 | $6,536 | $440,700 | $93,600 | $347,100 |
| 2023 | $5,952 | $433,800 | $88,300 | $345,500 |
| 2022 | $5,575 | $353,100 | $74,600 | $278,500 |
| 2021 | $5,434 | $325,400 | $74,600 | $250,800 |
| 2020 | $5,294 | $300,600 | $70,800 | $229,800 |
| 2019 | $5,272 | $294,700 | $67,400 | $227,300 |
| 2018 | $5,029 | $277,400 | $67,400 | $210,000 |
| 2017 | $5,082 | $277,400 | $67,400 | $210,000 |
| 2016 | $4,747 | $273,300 | $64,100 | $209,200 |
| 2015 | $4,686 | $265,500 | $64,100 | $201,400 |
| 2014 | $4,543 | $265,500 | $64,100 | $201,400 |
Source: Public Records
Map
Nearby Homes
- 0 Barclay Rd
- 211 Barre Paxton Rd Unit 4
- 0 Browning Pond Rd
- 43 Irish Ln
- 39 Irish Ln
- 37 Irish Ln
- LOT 8 Pierre Cir
- 47 Lakeshore Dr
- 5 Brigham Rd
- Lot 11 Pleasantdale Rd
- 238 Barre Paxton Rd Unit 238
- 196 N Spencer Rd
- 236 Turkey Hill Rd
- 18 Shore Dr
- 17 Shore Dr
- 12 South St
- 230 West St
- 7 Victoria Ave
- 4 Stevens Way
- Lot 1 Welch Ave