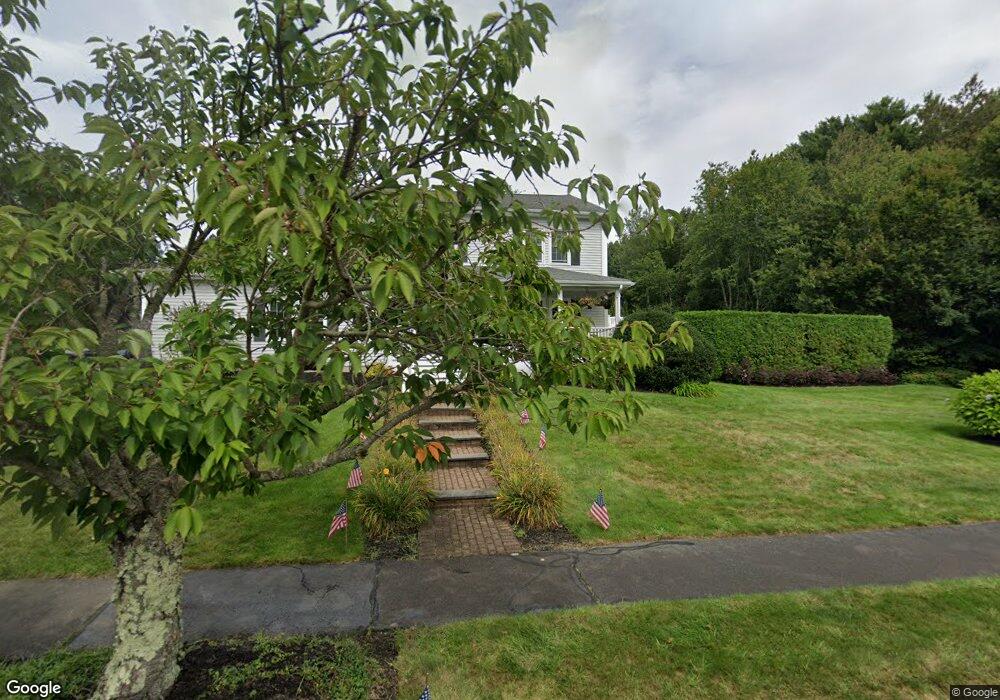
11 Magnolia Dr Rockland, MA 02370
Estimated Value: $774,000 - $886,781
4
Beds
4
Baths
3,032
Sq Ft
$276/Sq Ft
Est. Value
About This Home
This home is located at 11 Magnolia Dr, Rockland, MA 02370 and is currently estimated at $837,445, approximately $276 per square foot. 11 Magnolia Dr is a home located in Plymouth County with nearby schools including Rockland Senior High School, Calvary Chapel Academy, and St Bridget School.
Ownership History
Date
Name
Owned For
Owner Type
Purchase Details
Closed on
Apr 14, 2016
Sold by
Robson Dennis M and Robson Kathryn T
Bought by
Robson Dennis M and Robson Kathryn T
Current Estimated Value
Purchase Details
Closed on
Jul 19, 1995
Sold by
Oakridge Rt
Bought by
Robson Dennis M and Robson Kathryn T
Create a Home Valuation Report for This Property
The Home Valuation Report is an in-depth analysis detailing your home's value as well as a comparison with similar homes in the area
Home Values in the Area
Average Home Value in this Area
Purchase History
| Date | Buyer | Sale Price | Title Company |
|---|---|---|---|
| Robson Dennis M | -- | -- | |
| Robson Dennis M | $268,405 | -- |
Source: Public Records
Mortgage History
| Date | Status | Borrower | Loan Amount |
|---|---|---|---|
| Previous Owner | Robson Dennis M | $291,000 | |
| Previous Owner | Robson Dennis M | $60,000 | |
| Previous Owner | Robson Dennis M | $265,000 |
Source: Public Records
Tax History Compared to Growth
Tax History
| Year | Tax Paid | Tax Assessment Tax Assessment Total Assessment is a certain percentage of the fair market value that is determined by local assessors to be the total taxable value of land and additions on the property. | Land | Improvement |
|---|---|---|---|---|
| 2025 | $10,969 | $802,400 | $248,400 | $554,000 |
| 2024 | $10,652 | $757,600 | $234,300 | $523,300 |
| 2023 | $10,601 | $696,500 | $214,900 | $481,600 |
| 2022 | $10,259 | $612,500 | $186,900 | $425,600 |
| 2021 | $10,115 | $559,900 | $169,900 | $390,000 |
| 2020 | $9,483 | $541,900 | $169,500 | $372,400 |
| 2019 | $5,088 | $521,900 | $161,500 | $360,400 |
| 2018 | $16,708 | $494,600 | $168,800 | $325,800 |
| 2017 | $4,805 | $472,300 | $168,800 | $303,500 |
| 2016 | $8,535 | $461,600 | $162,300 | $299,300 |
| 2015 | $8,533 | $448,400 | $171,500 | $276,900 |
| 2014 | $8,073 | $440,200 | $168,200 | $272,000 |
Source: Public Records
Map
Nearby Homes
- 133 Spring St
- 20 Pat Rose Way
- 149 Concord St
- 6 Pat Rose Way
- 17 Pat Rose Way
- 8 Pat Rose Way
- 19 Pat Rose Way
- 810 Brookline Way
- 158 Central St
- 14 Daniel Teague Dr
- 140 W Water St
- 225 W Water St
- 696 Summer St
- 94-96 Crescent St
- 133 Crescent St
- 440 Market St
- 800 Plymouth St
- 137 Peregrine Rd
- 38 Levin Rd
- 103 Grove St Unit 337