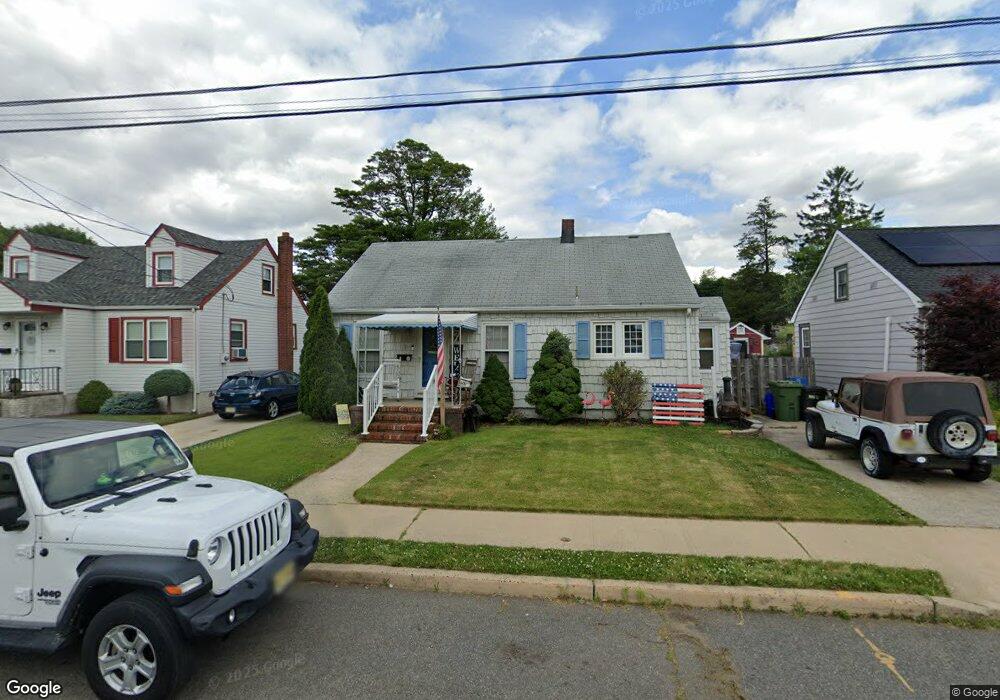
11 Manor St South Amboy, NJ 08879
Estimated Value: $409,880 - $439,000
--
Bed
--
Bath
816
Sq Ft
$518/Sq Ft
Est. Value
About This Home
This home is located at 11 Manor St, South Amboy, NJ 08879 and is currently estimated at $422,720, approximately $518 per square foot. 11 Manor St is a home located in Middlesex County with nearby schools including Sayreville War Memorial High School, St. Mary Elementary School, and Cardinal Mccarrick High School.
Ownership History
Date
Name
Owned For
Owner Type
Purchase Details
Closed on
Jan 27, 2022
Sold by
Ellen Dunn Mary
Bought by
Murphy Maureeen and Kern Edward
Current Estimated Value
Home Financials for this Owner
Home Financials are based on the most recent Mortgage that was taken out on this home.
Original Mortgage
$284,747
Outstanding Balance
$264,087
Interest Rate
3.45%
Mortgage Type
New Conventional
Estimated Equity
$158,633
Purchase Details
Closed on
Mar 24, 2004
Create a Home Valuation Report for This Property
The Home Valuation Report is an in-depth analysis detailing your home's value as well as a comparison with similar homes in the area
Home Values in the Area
Average Home Value in this Area
Purchase History
| Date | Buyer | Sale Price | Title Company |
|---|---|---|---|
| Murphy Maureeen | $290,000 | Vintage Title Services | |
| -- | $195,000 | -- |
Source: Public Records
Mortgage History
| Date | Status | Borrower | Loan Amount |
|---|---|---|---|
| Open | Murphy Maureeen | $284,747 |
Source: Public Records
Tax History Compared to Growth
Tax History
| Year | Tax Paid | Tax Assessment Tax Assessment Total Assessment is a certain percentage of the fair market value that is determined by local assessors to be the total taxable value of land and additions on the property. | Land | Improvement |
|---|---|---|---|---|
| 2025 | $6,319 | $103,500 | $52,400 | $51,100 |
| 2024 | $6,144 | $103,500 | $52,400 | $51,100 |
| 2023 | $6,144 | $103,500 | $52,400 | $51,100 |
| 2022 | $5,739 | $103,500 | $52,400 | $51,100 |
| 2021 | $5,676 | $103,500 | $52,400 | $51,100 |
| 2020 | $5,532 | $103,500 | $52,400 | $51,100 |
| 2019 | $5,416 | $103,500 | $52,400 | $51,100 |
| 2018 | $5,319 | $103,500 | $52,400 | $51,100 |
| 2017 | $5,196 | $103,500 | $52,400 | $51,100 |
| 2016 | $5,057 | $103,500 | $52,400 | $51,100 |
| 2015 | $4,942 | $103,500 | $52,400 | $51,100 |
| 2014 | $4,810 | $103,500 | $52,400 | $51,100 |
Source: Public Records
Map
Nearby Homes
- 161 Manor St
- 503 Woodland Ave
- 433 Gordon St
- 320 Parker Ave
- 158 Liberty St St
- 158 Liberty St
- 442 Bordentown Ave
- 411 Lefferts St
- 805 Bayside Ct
- 224 Gordon St
- 380 Prospect St
- 21 Luke St
- 528 Catherine St
- 15 Bertram Ave
- 322 George St
- 237 George St
- 504 Colonel D B Kelly Way
- 504 Col Db Kelly Way
- 92 S Shore Dr
- 741 Bordentown Ave