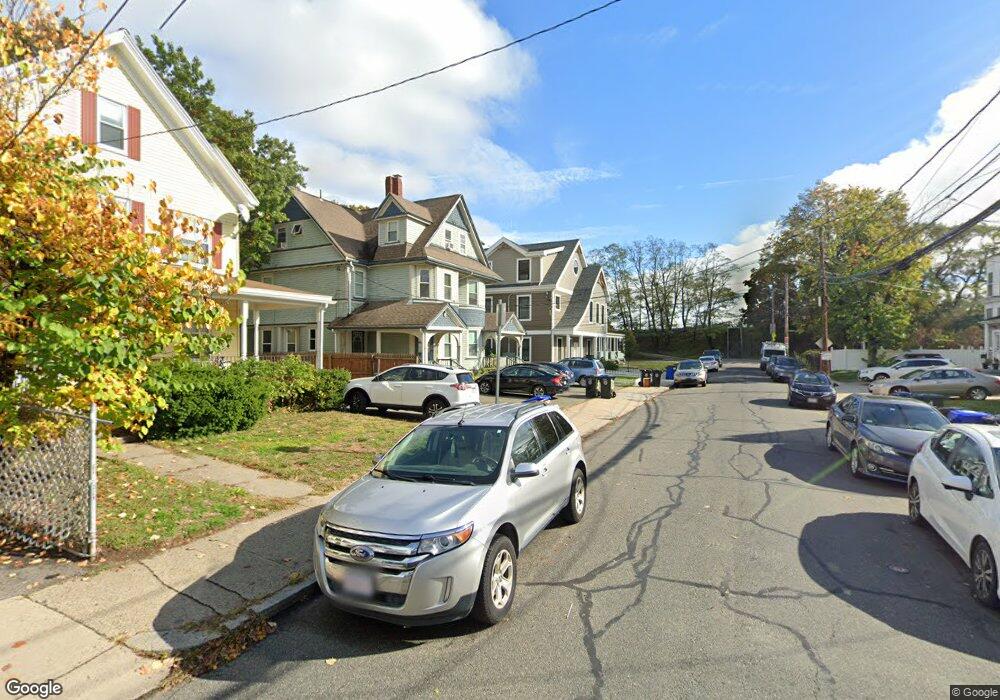
11 Mansfield St Unit 13 Allston, MA 02134
Allston NeighborhoodEstimated Value: $357,000 - $452,000
1
Bed
1
Bath
725
Sq Ft
$581/Sq Ft
Est. Value
About This Home
This home is located at 11 Mansfield St Unit 13, Allston, MA 02134 and is currently estimated at $420,950, approximately $580 per square foot. 11 Mansfield St Unit 13 is a home located in Suffolk County with nearby schools including Match Charter Public School, German International School Boston, and St Herman Of Alaska Christian School.
Ownership History
Date
Name
Owned For
Owner Type
Purchase Details
Closed on
Nov 14, 2013
Sold by
Quense Cynthia L and Hughes Timothy E
Bought by
Torres Jose O
Current Estimated Value
Home Financials for this Owner
Home Financials are based on the most recent Mortgage that was taken out on this home.
Original Mortgage
$75,000
Outstanding Balance
$20,016
Interest Rate
4.24%
Mortgage Type
New Conventional
Estimated Equity
$400,934
Purchase Details
Closed on
Jan 12, 1994
Sold by
Garrity Thomas E
Bought by
Fdic
Purchase Details
Closed on
Jun 3, 1991
Sold by
Blackberry Tree Condo
Bought by
B B J Rt
Home Financials for this Owner
Home Financials are based on the most recent Mortgage that was taken out on this home.
Original Mortgage
$80,000
Interest Rate
9.35%
Mortgage Type
Purchase Money Mortgage
Purchase Details
Closed on
Nov 12, 1987
Sold by
Capital Assocs Tr B
Bought by
Iii Thomas E Garrity
Home Financials for this Owner
Home Financials are based on the most recent Mortgage that was taken out on this home.
Original Mortgage
$80,000
Interest Rate
11.13%
Mortgage Type
Purchase Money Mortgage
Create a Home Valuation Report for This Property
The Home Valuation Report is an in-depth analysis detailing your home's value as well as a comparison with similar homes in the area
Home Values in the Area
Average Home Value in this Area
Purchase History
| Date | Buyer | Sale Price | Title Company |
|---|---|---|---|
| Torres Jose O | -- | -- | |
| Fdic | $57,219 | -- | |
| B B J Rt | $100,000 | -- | |
| Iii Thomas E Garrity | $100,000 | -- |
Source: Public Records
Mortgage History
| Date | Status | Borrower | Loan Amount |
|---|---|---|---|
| Open | Torres Jose O | $75,000 | |
| Previous Owner | Iii Thomas E Garrity | $80,000 | |
| Previous Owner | Iii Thomas E Garrity | $80,000 |
Source: Public Records
Tax History
| Year | Tax Paid | Tax Assessment Tax Assessment Total Assessment is a certain percentage of the fair market value that is determined by local assessors to be the total taxable value of land and additions on the property. | Land | Improvement |
|---|---|---|---|---|
| 2025 | $4,778 | $412,600 | $0 | $412,600 |
| 2024 | $4,086 | $374,900 | $0 | $374,900 |
| 2023 | $3,763 | $350,400 | $0 | $350,400 |
| 2022 | $3,563 | $327,500 | $0 | $327,500 |
| 2021 | $3,640 | $341,100 | $0 | $341,100 |
| 2020 | $3,449 | $326,600 | $0 | $326,600 |
| 2019 | $3,072 | $291,500 | $0 | $291,500 |
| 2018 | $2,881 | $274,900 | $0 | $274,900 |
| 2017 | $2,696 | $254,600 | $0 | $254,600 |
| 2016 | $2,570 | $233,600 | $0 | $233,600 |
| 2015 | -- | $213,900 | $0 | $213,900 |
| 2014 | -- | $196,200 | $0 | $196,200 |
Source: Public Records
Map
Nearby Homes
- 5 Alcott St
- 63 Coolidge Rd
- 27 Coolidge Rd Unit 1
- 35-37 Haskell St
- 4 Franklin St Unit 202
- 4 Franklin St Unit 401
- 35 Adamson St
- 172-174 Franklin St
- 20 Penniman Rd Unit P3
- 59 Brighton Ave Unit 1
- 59 Brighton Ave Unit A
- 57 Brighton Ave Unit C
- 57 Brighton Ave Unit B
- 30 Penniman Rd Unit 702
- 30 Penniman Rd Unit 201
- 30 Penniman Rd Unit 206
- 30 Penniman Rd Unit 302
- 56 Park Vale Ave Unit 4
- 84 Linden St
- 231 Everett St Unit 1
- 13 Mansfield St Unit 4
- 11 Mansfield St Unit 13
- 11 Mansfield St Unit 13
- 11 Mansfield St Unit 13
- 11 Mansfield St Unit 2
- 13 Mansfield St
- 13 Mansfield St Unit 1R
- 11 Mansfield St Unit 9 1
- 11-13 Mansfield St Unit 2
- 11 Mansfield St Unit 4
- 11 Mansfield St Unit 9 4
- 11 Mansfield St
- 13 Mansfield St Unit 7
- 11-13 Mansfield St
- 11 Mansfield St Unit 3
- 11 Mansfield St Unit 7
- 13 Mansfield St Unit 3
- 11-13 Mansfield St Unit 8
- 11-13 Mansfield St Unit 5
- 11-13 Mansfield St Unit 7
Your Personal Tour Guide
Ask me questions while you tour the home.