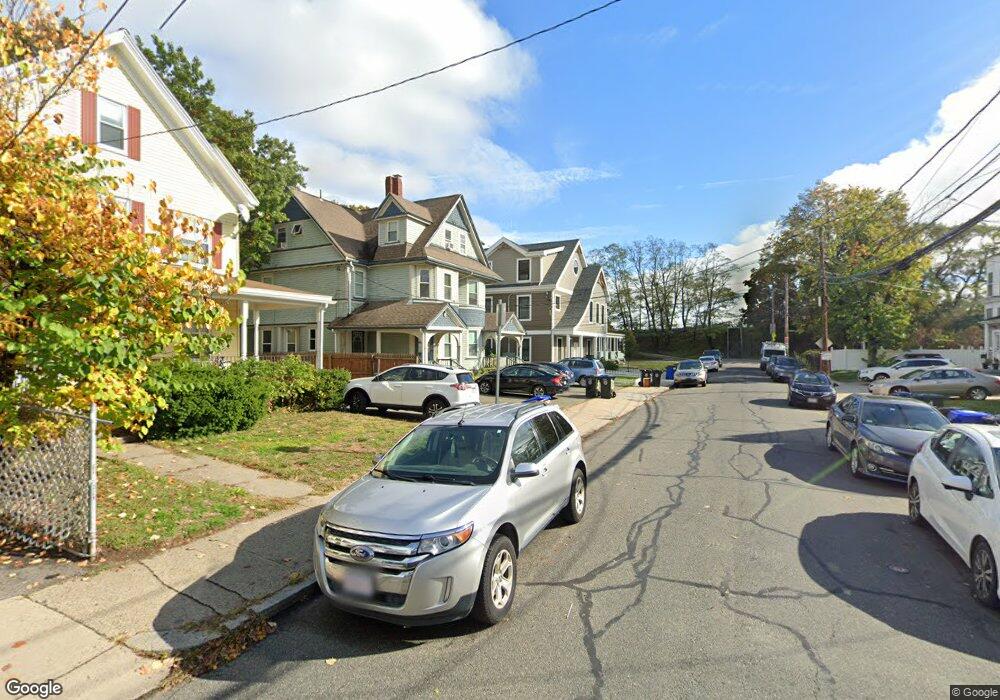
11 Mansfield St Unit 2 Allston, MA 02134
Allston NeighborhoodEstimated Value: $359,000 - $486,000
1
Bed
1
Bath
700
Sq Ft
$619/Sq Ft
Est. Value
About This Home
This home is located at 11 Mansfield St Unit 2, Allston, MA 02134 and is currently estimated at $433,065, approximately $618 per square foot. 11 Mansfield St Unit 2 is a home located in Suffolk County with nearby schools including Match Charter Public School, German International School Boston, and St Herman Of Alaska Christian School.
Ownership History
Date
Name
Owned For
Owner Type
Purchase Details
Closed on
Feb 5, 2020
Sold by
Mosca Hillary
Bought by
Carnevali Giuseppe
Current Estimated Value
Purchase Details
Closed on
Jan 12, 1994
Sold by
Ryan Donald W and Cap Mtg Co Inc
Bought by
Fdic
Purchase Details
Closed on
Jun 3, 1991
Sold by
Blackberry Tree Condo
Bought by
Realty T 590
Home Financials for this Owner
Home Financials are based on the most recent Mortgage that was taken out on this home.
Original Mortgage
$80,000
Interest Rate
9.35%
Mortgage Type
Purchase Money Mortgage
Purchase Details
Closed on
Nov 12, 1987
Sold by
Capital Assocs Tr B
Bought by
Garrity Thomas E
Home Financials for this Owner
Home Financials are based on the most recent Mortgage that was taken out on this home.
Original Mortgage
$77,600
Interest Rate
11.13%
Mortgage Type
Purchase Money Mortgage
Create a Home Valuation Report for This Property
The Home Valuation Report is an in-depth analysis detailing your home's value as well as a comparison with similar homes in the area
Home Values in the Area
Average Home Value in this Area
Purchase History
| Date | Buyer | Sale Price | Title Company |
|---|---|---|---|
| Carnevali Giuseppe | $318,000 | None Available | |
| Fdic | $51,689 | -- | |
| Realty T 590 | $100,000 | -- | |
| Garrity Thomas E | $97,000 | -- |
Source: Public Records
Mortgage History
| Date | Status | Borrower | Loan Amount |
|---|---|---|---|
| Previous Owner | Garrity Thomas E | $80,000 | |
| Previous Owner | Garrity Thomas E | $77,600 |
Source: Public Records
Property History
| Date | Event | Price | List to Sale | Price per Sq Ft |
|---|---|---|---|---|
| 11/29/2024 11/29/24 | Off Market | $2,150 | -- | -- |
| 11/29/2024 11/29/24 | Off Market | $1,900 | -- | -- |
| 09/27/2024 09/27/24 | For Rent | $2,150 | +13.2% | -- |
| 09/27/2024 09/27/24 | For Rent | $1,900 | -- | -- |
Tax History Compared to Growth
Tax History
| Year | Tax Paid | Tax Assessment Tax Assessment Total Assessment is a certain percentage of the fair market value that is determined by local assessors to be the total taxable value of land and additions on the property. | Land | Improvement |
|---|---|---|---|---|
| 2025 | $4,698 | $405,700 | $0 | $405,700 |
| 2024 | $3,980 | $365,100 | $0 | $365,100 |
| 2023 | $3,664 | $341,200 | $0 | $341,200 |
| 2022 | $3,470 | $318,900 | $0 | $318,900 |
| 2021 | $3,545 | $332,200 | $0 | $332,200 |
| 2020 | $2,960 | $280,300 | $0 | $280,300 |
| 2019 | $2,638 | $250,300 | $0 | $250,300 |
| 2018 | $2,473 | $236,000 | $0 | $236,000 |
| 2017 | $2,315 | $218,600 | $0 | $218,600 |
| 2016 | $2,206 | $200,500 | $0 | $200,500 |
| 2015 | $2,275 | $187,900 | $0 | $187,900 |
| 2014 | $2,169 | $172,400 | $0 | $172,400 |
Source: Public Records
Map
Nearby Homes
- 27 Coolidge Rd Unit 1
- 1 Highgate St
- 8 Franklin St Unit 202
- 8 Franklin St Unit 401
- 4 Franklin St Unit 403
- 106 Chester St Unit 3
- 195 Cambridge St Unit 3
- 97 Chester St Unit 8
- 35 Adamson St
- 42 Hopedale St
- 20 Penniman Rd Unit P3
- 20 Penniman Rd Unit 208
- 59 Brighton Ave Unit 1
- 57 Brighton Ave Unit C
- 57 Brighton Ave Unit B
- 30 Penniman Rd Unit 201
- 54-60 Holton St Unit 58
- 231 Everett St Unit 1
- 21 Park Vale Ave Unit 2
- 15 N Beacon St Unit 328
- 13 Mansfield St Unit 4
- 11 Mansfield St Unit 13
- 11 Mansfield St Unit 13
- 11 Mansfield St Unit 13
- 11 Mansfield St Unit 13
- 13 Mansfield St
- 13 Mansfield St Unit 1R
- 11 Mansfield St Unit 9 1
- 11-13 Mansfield St Unit 2
- 11 Mansfield St Unit 4
- 11 Mansfield St Unit 9 4
- 11 Mansfield St
- 13 Mansfield St Unit 7
- 11-13 Mansfield St
- 11 Mansfield St Unit 3
- 11 Mansfield St Unit 7
- 13 Mansfield St Unit 3
- 11-13 Mansfield St Unit 8
- 11-13 Mansfield St Unit 5
- 11-13 Mansfield St Unit 7