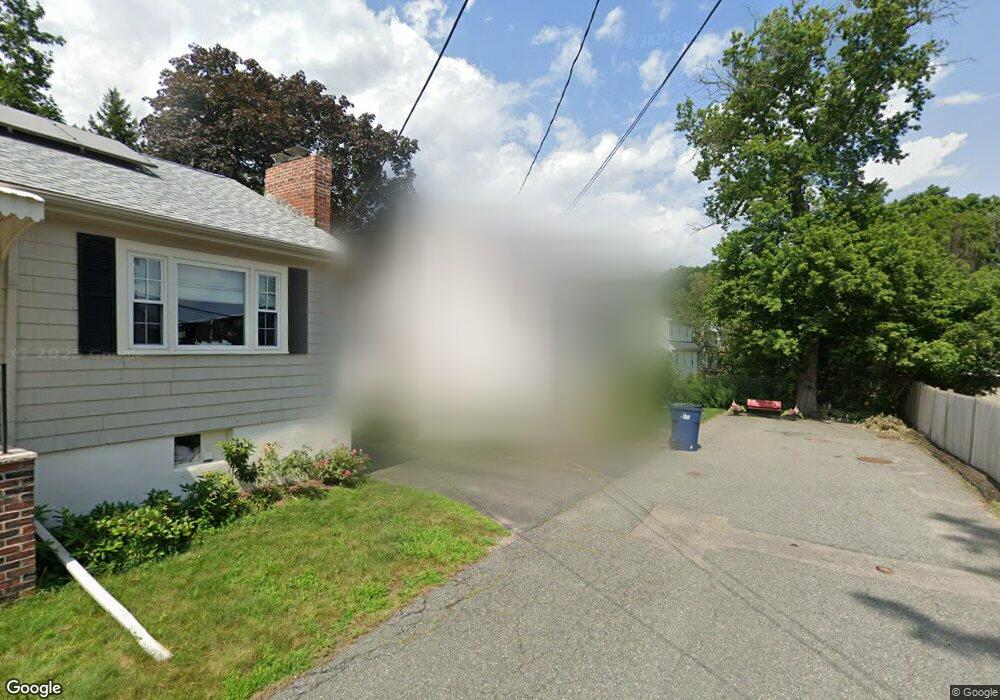
11 Maple Ln West Roxbury, MA 02132
West Roxbury NeighborhoodEstimated Value: $703,596 - $802,000
3
Beds
2
Baths
1,155
Sq Ft
$646/Sq Ft
Est. Value
About This Home
This home is located at 11 Maple Ln, West Roxbury, MA 02132 and is currently estimated at $746,149, approximately $646 per square foot. 11 Maple Ln is a home located in Suffolk County with nearby schools including Holy Name Parish School, St Theresa School, and The Roxbury Latin School.
Ownership History
Date
Name
Owned For
Owner Type
Purchase Details
Closed on
Oct 31, 2003
Sold by
Haddad Constance
Bought by
Dolan Karen A and Dolan John J
Current Estimated Value
Home Financials for this Owner
Home Financials are based on the most recent Mortgage that was taken out on this home.
Original Mortgage
$279,200
Interest Rate
6.05%
Mortgage Type
Purchase Money Mortgage
Create a Home Valuation Report for This Property
The Home Valuation Report is an in-depth analysis detailing your home's value as well as a comparison with similar homes in the area
Home Values in the Area
Average Home Value in this Area
Purchase History
| Date | Buyer | Sale Price | Title Company |
|---|---|---|---|
| Dolan Karen A | $349,000 | -- |
Source: Public Records
Mortgage History
| Date | Status | Borrower | Loan Amount |
|---|---|---|---|
| Open | Dolan Karen A | $248,000 | |
| Closed | Dolan Karen A | $279,200 | |
| Closed | Dolan Karen A | $20,800 |
Source: Public Records
Tax History
| Year | Tax Paid | Tax Assessment Tax Assessment Total Assessment is a certain percentage of the fair market value that is determined by local assessors to be the total taxable value of land and additions on the property. | Land | Improvement |
|---|---|---|---|---|
| 2025 | $6,606 | $570,500 | $218,600 | $351,900 |
| 2024 | $6,226 | $571,200 | $227,700 | $343,500 |
| 2023 | $5,786 | $538,700 | $214,700 | $324,000 |
| 2022 | $5,328 | $489,700 | $195,200 | $294,500 |
| 2021 | $4,966 | $465,400 | $187,700 | $277,700 |
| 2020 | $4,341 | $411,100 | $169,500 | $241,600 |
| 2019 | $4,048 | $384,100 | $140,900 | $243,200 |
| 2018 | $3,871 | $369,400 | $140,900 | $228,500 |
| 2017 | $3,873 | $365,700 | $140,900 | $224,800 |
| 2016 | $3,760 | $341,800 | $140,900 | $200,900 |
| 2015 | $3,799 | $313,700 | $133,500 | $180,200 |
| 2014 | $3,939 | $313,100 | $133,500 | $179,600 |
Source: Public Records
Map
Nearby Homes
- 72 Redlands Rd
- 37 Hastings St Unit 103
- 20 Manthorne Rd Unit 2
- 104 Greaton Rd
- 24 Rhoda St
- 311 Belgrade Ave
- 150 Tyndale St Unit 2
- 425 Lagrange St Unit 203
- 152 Stratford St
- 73 Dent St Unit 2
- 73 Dent St Unit 1
- 281 Belgrade Ave Unit 2
- 348 Lagrange St
- 701 Vfw Pkwy
- 183 Temple St
- 73 Woodard Rd
- 83 Aldrich St Unit 1
- 95 Newburg St
- 231 Lagrange St
- 26 Bradfield Ave Unit 3