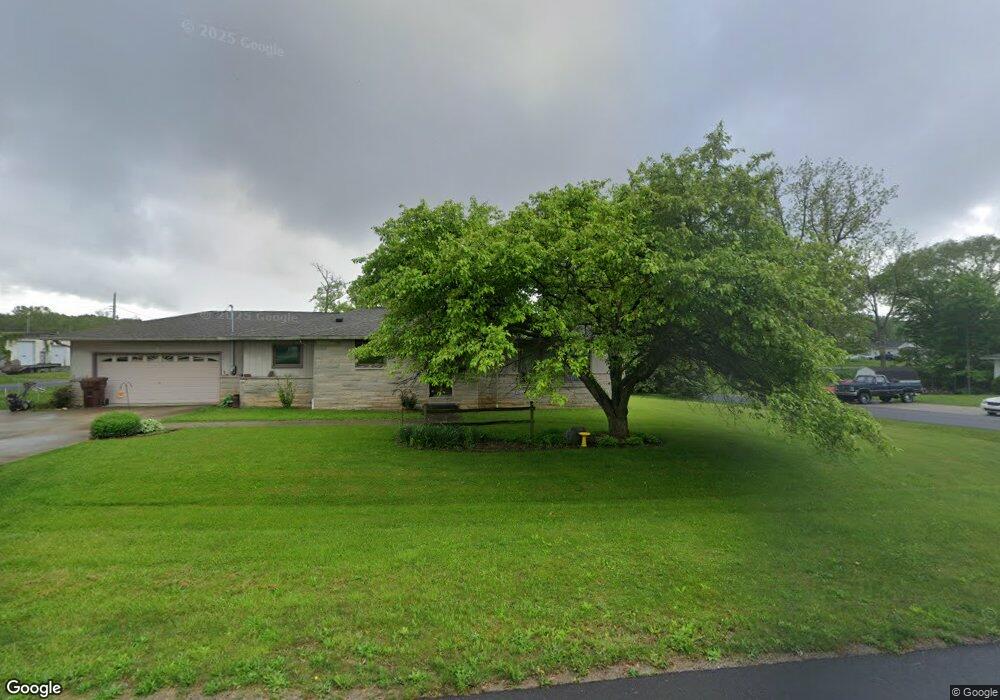
11 Maple St Somerset, IN 46984
Estimated Value: $182,000 - $240,000
5
Beds
2
Baths
1,640
Sq Ft
$128/Sq Ft
Est. Value
About This Home
This home is located at 11 Maple St, Somerset, IN 46984 and is currently estimated at $210,250, approximately $128 per square foot. 11 Maple St is a home located in Wabash County.
Ownership History
Date
Name
Owned For
Owner Type
Purchase Details
Closed on
Jan 15, 2019
Sold by
Stefanatos Sheila S
Bought by
Stefanatos Peter M
Current Estimated Value
Home Financials for this Owner
Home Financials are based on the most recent Mortgage that was taken out on this home.
Original Mortgage
$93,500
Outstanding Balance
$81,378
Interest Rate
4.6%
Mortgage Type
Commercial
Estimated Equity
$128,872
Purchase Details
Closed on
Mar 7, 2012
Sold by
Lord Kenton M and Lord Ruth
Bought by
Stefanatos Peter M and Stefanatos Sheila S
Home Financials for this Owner
Home Financials are based on the most recent Mortgage that was taken out on this home.
Original Mortgage
$101,000
Interest Rate
4.01%
Mortgage Type
New Conventional
Create a Home Valuation Report for This Property
The Home Valuation Report is an in-depth analysis detailing your home's value as well as a comparison with similar homes in the area
Purchase History
| Date | Buyer | Sale Price | Title Company |
|---|---|---|---|
| Stefanatos Peter M | -- | None Available | |
| Stefanatos Peter M | -- | None Available |
Source: Public Records
Mortgage History
| Date | Status | Borrower | Loan Amount |
|---|---|---|---|
| Open | Stefanatos Peter M | $93,500 | |
| Closed | Stefanatos Peter M | $101,000 |
Source: Public Records
Tax History
| Year | Tax Paid | Tax Assessment Tax Assessment Total Assessment is a certain percentage of the fair market value that is determined by local assessors to be the total taxable value of land and additions on the property. | Land | Improvement |
|---|---|---|---|---|
| 2025 | $1,032 | $187,600 | $17,000 | $170,600 |
| 2024 | $1,032 | $186,100 | $17,000 | $169,100 |
| 2023 | $942 | $184,600 | $17,000 | $167,600 |
| 2022 | $704 | $167,200 | $13,600 | $153,600 |
| 2021 | $626 | $143,500 | $13,600 | $129,900 |
| 2020 | $565 | $138,200 | $13,600 | $124,600 |
| 2019 | $465 | $126,400 | $13,600 | $112,800 |
| 2018 | $435 | $122,100 | $13,600 | $108,500 |
| 2017 | $394 | $116,500 | $13,600 | $102,900 |
| 2016 | $259 | $113,300 | $13,600 | $99,700 |
| 2014 | $271 | $125,900 | $13,600 | $112,300 |
| 2013 | $213 | $123,300 | $13,600 | $109,700 |
Source: Public Records
Map
Nearby Homes
- 15 S Second St
- 100 N Delaware Ln
- 75 W Old Trail
- 5894 N 800 W 27
- 3576 W 505 N
- 7649 E 850 S
- 3 Mason St
- 204 S Main St
- 3283 County Road 800th S
- 3192 E 800 S Unit 2
- 5317 Bechtel Ct
- 512 E Kendall St
- 102 W Harrison St
- 106 W Water St
- 1006 E Delphi St
- 8540 W Delphi Pike
- 40 Howard St
- 37 Howard St
- 5292 W Delphi Pike
- 308 S Main St
Your Personal Tour Guide
Ask me questions while you tour the home.