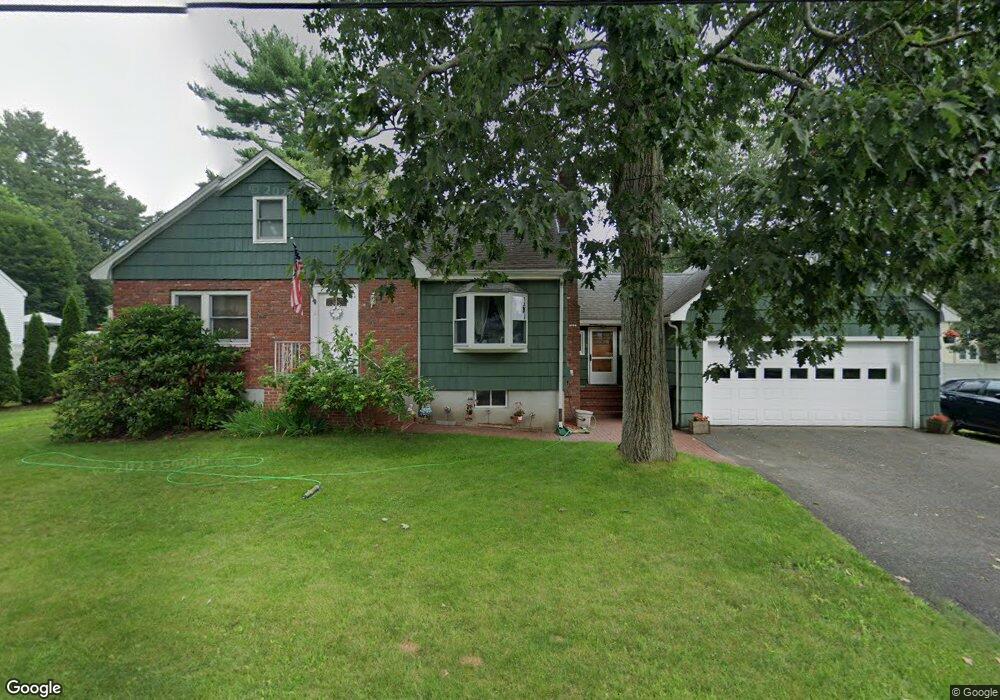
11 Marcus Rd Wilmington, MA 01887
Estimated Value: $748,000 - $808,000
3
Beds
2
Baths
1,757
Sq Ft
$440/Sq Ft
Est. Value
About This Home
This home is located at 11 Marcus Rd, Wilmington, MA 01887 and is currently estimated at $773,264, approximately $440 per square foot. 11 Marcus Rd is a home located in Middlesex County with nearby schools including Wilmington Middle School, Wilmington High School, and N Reading Knowledge Beginnings.
Ownership History
Date
Name
Owned For
Owner Type
Purchase Details
Closed on
May 28, 1999
Sold by
Zolondick Martin
Bought by
Greer Brenda J
Current Estimated Value
Home Financials for this Owner
Home Financials are based on the most recent Mortgage that was taken out on this home.
Original Mortgage
$192,600
Interest Rate
6.82%
Mortgage Type
Purchase Money Mortgage
Create a Home Valuation Report for This Property
The Home Valuation Report is an in-depth analysis detailing your home's value as well as a comparison with similar homes in the area
Purchase History
| Date | Buyer | Sale Price | Title Company |
|---|---|---|---|
| Greer Brenda J | $214,000 | -- |
Source: Public Records
Mortgage History
| Date | Status | Borrower | Loan Amount |
|---|---|---|---|
| Open | Greer Brenda J | $150,000 | |
| Closed | Greer Brenda J | $183,000 | |
| Closed | Greer Brenda J | $192,600 |
Source: Public Records
Tax History
| Year | Tax Paid | Tax Assessment Tax Assessment Total Assessment is a certain percentage of the fair market value that is determined by local assessors to be the total taxable value of land and additions on the property. | Land | Improvement |
|---|---|---|---|---|
| 2025 | $7,571 | $661,200 | $299,800 | $361,400 |
| 2024 | $7,224 | $632,000 | $299,800 | $332,200 |
| 2023 | $7,162 | $599,800 | $272,500 | $327,300 |
| 2022 | $6,948 | $533,200 | $227,000 | $306,200 |
| 2021 | $6,804 | $491,600 | $206,400 | $285,200 |
| 2020 | $6,666 | $490,900 | $206,400 | $284,500 |
| 2019 | $6,632 | $482,300 | $196,600 | $285,700 |
| 2018 | $6,264 | $434,700 | $187,200 | $247,500 |
| 2017 | $5,881 | $407,000 | $178,300 | $228,700 |
| 2016 | $5,704 | $389,900 | $169,800 | $220,100 |
| 2015 | $5,419 | $377,100 | $169,800 | $207,300 |
| 2014 | $5,149 | $361,600 | $161,700 | $199,900 |
Source: Public Records
Map
Nearby Homes
- 41 Marcus Rd
- 21 Marcia Rd
- 17 Carson Ave
- 10 Pilling Rd
- 9 Marie Dr
- 15 Mystic Ave
- 280 Martins Landing Unit 312
- 12 Hamlin Ln
- 220 Martins Landing Unit 309
- 260 Martins Landing Unit 508
- 200 Martins Landing Unit 102
- 250 Martins Landing Unit 402
- 320 Martins Landing Unit 401
- 320 Martins Landing Unit 2410
- 320 Martins Landing Unit 502
- 320 Martins Landing Unit 102
- 320 Martins Landing Unit 107
- 320 Martins Landing Unit 404
- 320 Martins Landing Unit 209
- 28 Nutter Rd
Your Personal Tour Guide
Ask me questions while you tour the home.