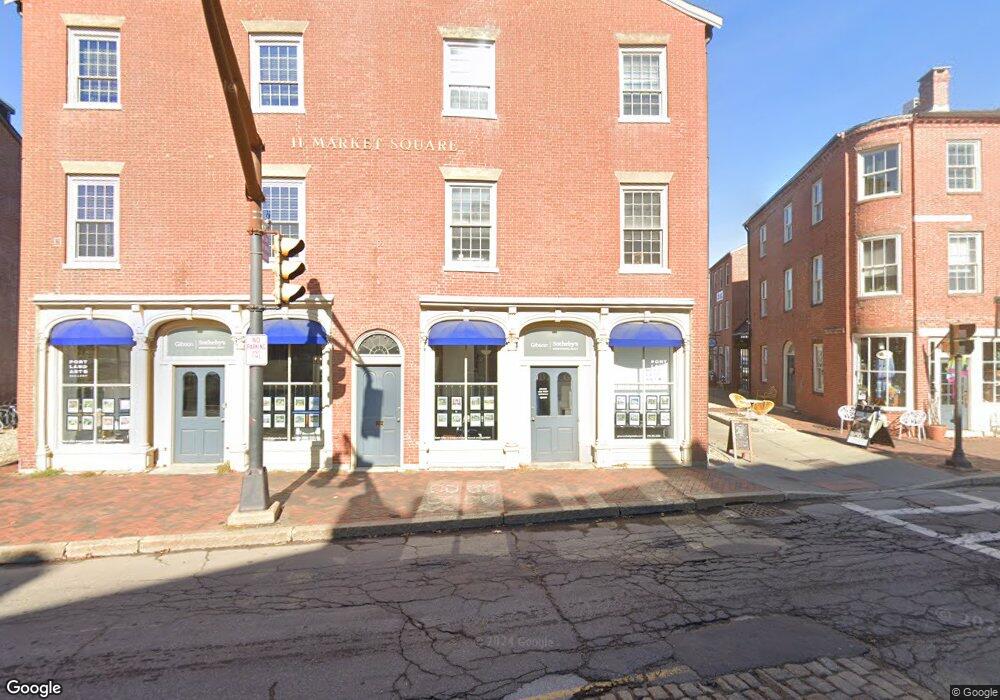
11 Market Square Unit 5 Newburyport, MA 01950
Estimated Value: $354,827
1
Bed
2
Baths
603
Sq Ft
$588/Sq Ft
Est. Value
About This Home
This home is located at 11 Market Square Unit 5, Newburyport, MA 01950 and is currently estimated at $354,827, approximately $588 per square foot. 11 Market Square Unit 5 is a home located in Essex County with nearby schools including Francis T. Bresnahan Elementary School, Edward G. Molin Elementary School, and Rupert A. Nock Middle School.
Ownership History
Date
Name
Owned For
Owner Type
Purchase Details
Closed on
Sep 21, 2012
Sold by
Miller Market Square R
Bought by
11 & 5 Market Sq Rlty Ll
Current Estimated Value
Home Financials for this Owner
Home Financials are based on the most recent Mortgage that was taken out on this home.
Original Mortgage
$75,000
Outstanding Balance
$51,946
Interest Rate
3.59%
Mortgage Type
Commercial
Estimated Equity
$302,881
Create a Home Valuation Report for This Property
The Home Valuation Report is an in-depth analysis detailing your home's value as well as a comparison with similar homes in the area
Home Values in the Area
Average Home Value in this Area
Purchase History
| Date | Buyer | Sale Price | Title Company |
|---|---|---|---|
| 11 & 5 Market Sq Rlty Ll | $125,000 | -- |
Source: Public Records
Mortgage History
| Date | Status | Borrower | Loan Amount |
|---|---|---|---|
| Open | 11 & 5 Market Sq Rlty Ll | $75,000 | |
| Closed | 11 & 5 Market Sq Rlty Ll | $75,000 |
Source: Public Records
Tax History Compared to Growth
Tax History
| Year | Tax Paid | Tax Assessment Tax Assessment Total Assessment is a certain percentage of the fair market value that is determined by local assessors to be the total taxable value of land and additions on the property. | Land | Improvement |
|---|---|---|---|---|
| 2025 | $1,571 | $164,000 | $0 | $164,000 |
| 2024 | $1,585 | $159,000 | $0 | $159,000 |
| 2023 | $1,681 | $156,500 | $0 | $156,500 |
| 2022 | $1,880 | $156,500 | $0 | $156,500 |
| 2021 | $1,885 | $149,100 | $0 | $149,100 |
| 2020 | $1,914 | $149,100 | $0 | $149,100 |
| 2019 | $1,687 | $129,000 | $0 | $129,000 |
| 2018 | $1,586 | $119,600 | $0 | $119,600 |
| 2017 | $1,609 | $119,600 | $0 | $119,600 |
| 2016 | $1,559 | $116,400 | $0 | $116,400 |
| 2015 | $1,553 | $116,400 | $0 | $116,400 |
Source: Public Records
Map
Nearby Homes
- 10 10th St
- 14 Spring St
- 9 Orange St Unit 1
- 9 Orange St
- 42 Federal St Unit B
- 2 Court St Unit 4
- 4 School St
- 15 Beck St Unit 1
- 15 Beck St
- 95 High St Unit 4
- 126 Merrimac St Unit 31
- 126 Merrimac St Unit 29
- 126 Merrimac St Unit 50
- 126 Merrimac St Unit 18
- 175 Bridge Rd
- 129 Merrimac St Unit 16
- 129 Merrimac St Unit 20
- 2 Scholtz Terrace
- 58 Lime St Unit 5
- 158 Merrimac St Unit 3
- 11 Market Square Unit 9/10/11
- 11 Market Square Unit 8
- 11 Market Square Unit 7
- 11 Market Square Unit 6
- 11 Market Square Unit 5,6,7,8
- 11 Market Square Unit 7,8
- 11 Market Square Unit 5,6
- 11 Market Square Unit 4
- 11 Market Square Unit 3
- 11 Market Square Unit 2
- 11 Market Square Unit 1
- 11 Market Square Unit 10
- 11 Market Square Unit 11
- 11 Market Square
- 1 Water St Unit R
- 1 Water St Unit Rear
- 1 Water St
- 1-5 Water St
- 5 Water St Unit 5
- 5 Water St Unit B