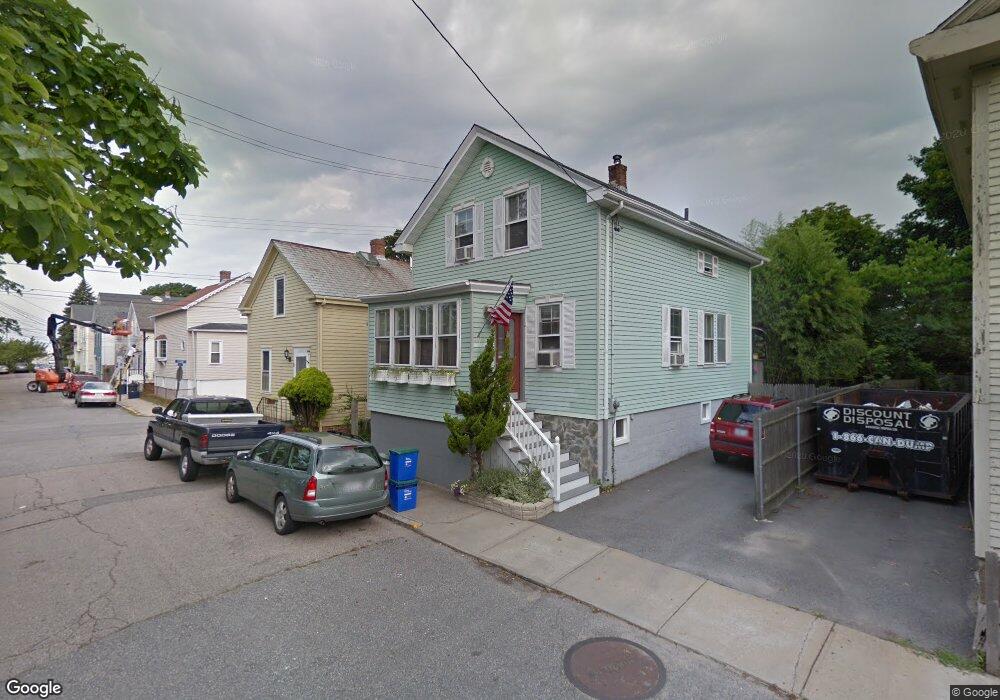
11 Marsh St Newport, RI 02840
Estimated Value: $885,405 - $1,193,000
3
Beds
2
Baths
1,320
Sq Ft
$798/Sq Ft
Est. Value
About This Home
This home is located at 11 Marsh St, Newport, RI 02840 and is currently estimated at $1,053,101, approximately $797 per square foot. 11 Marsh St is a home located in Newport County with nearby schools including Rogers High School, St Michael's Country Day School, and St George's School.
Ownership History
Date
Name
Owned For
Owner Type
Purchase Details
Closed on
May 25, 2023
Sold by
Mcvicar Ronald J
Bought by
Fair Winds T and Fair Mcvicar
Current Estimated Value
Purchase Details
Closed on
Aug 30, 2002
Sold by
Powell Gusina
Bought by
Mcvicar Ronald J
Home Financials for this Owner
Home Financials are based on the most recent Mortgage that was taken out on this home.
Original Mortgage
$252,000
Interest Rate
6.55%
Mortgage Type
Purchase Money Mortgage
Create a Home Valuation Report for This Property
The Home Valuation Report is an in-depth analysis detailing your home's value as well as a comparison with similar homes in the area
Home Values in the Area
Average Home Value in this Area
Purchase History
| Date | Buyer | Sale Price | Title Company |
|---|---|---|---|
| Fair Winds T | -- | None Available | |
| Mcvicar Ronald J | $315,000 | -- |
Source: Public Records
Mortgage History
| Date | Status | Borrower | Loan Amount |
|---|---|---|---|
| Previous Owner | Mcvicar Ronald J | $230,000 | |
| Previous Owner | Mcvicar Ronald J | $252,000 |
Source: Public Records
Tax History Compared to Growth
Tax History
| Year | Tax Paid | Tax Assessment Tax Assessment Total Assessment is a certain percentage of the fair market value that is determined by local assessors to be the total taxable value of land and additions on the property. | Land | Improvement |
|---|---|---|---|---|
| 2025 | $6,897 | $793,800 | $439,400 | $354,400 |
| 2024 | $6,525 | $793,800 | $439,400 | $354,400 |
| 2023 | $5,200 | $524,200 | $289,300 | $234,900 |
| 2022 | $5,038 | $524,200 | $289,300 | $234,900 |
| 2021 | $4,891 | $524,200 | $289,300 | $234,900 |
| 2020 | $4,435 | $431,400 | $280,000 | $151,400 |
| 2019 | $4,435 | $431,400 | $280,000 | $151,400 |
| 2018 | $4,310 | $431,400 | $280,000 | $151,400 |
| 2017 | $3,985 | $355,500 | $215,200 | $140,300 |
| 2016 | $3,886 | $355,500 | $215,200 | $140,300 |
| 2015 | $3,793 | $355,500 | $215,200 | $140,300 |
| 2014 | $3,666 | $304,000 | $168,300 | $135,700 |
Source: Public Records
Map
Nearby Homes
- 0 Second St
- 35 Second St
- 43 Poplar St
- 12 Poplar St
- 11 Willow St Unit 5
- 23 Willow St
- 44 Third St
- 31 Coddington St Unit 24
- 17 Warner St
- 6 Sunshine Ct
- 27 Soar Way
- 74 Third St
- 10 Barney St Unit 102
- 10 Barney St Unit 107
- 10 Barney St Unit 101
- 10 Barney St Unit U106
- 102 Broadway Unit 2B
- 130 Spring St Unit 132
- 12 Mount Vernon St Unit 5
- 5 Bowser Ct