11 Mason St Unit 1 Wareham, MA 02532
Estimated Value: $442,000 - $524,000
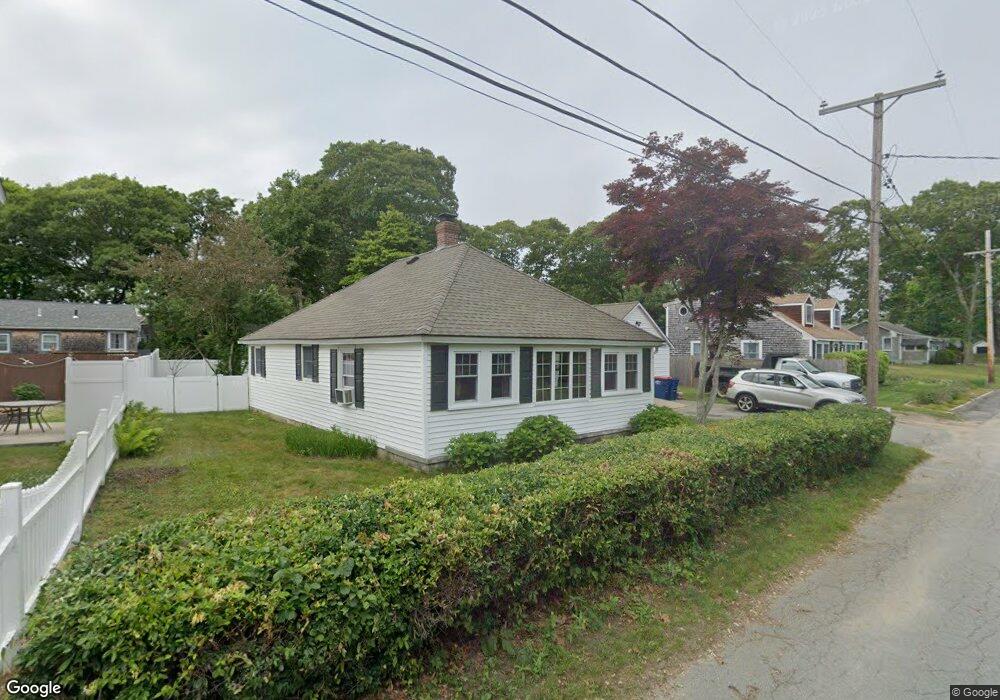
About This Home
This home is located at 11 Mason St Unit 1, Wareham, MA 02532 and is currently estimated at $491,320, approximately $465 per square foot. 11 Mason St Unit 1 is a home located in Plymouth County.
Ownership History
We collect this data history from publicly available records. To have your information removed, we recommend requesting removal directly through your county’s website.
Purchase Details
Purchase Details
Purchase Details
Purchase Details
Home Financials for this Owner
Home Financials are based on the most recent Mortgage that was taken out on this home.Purchase Details
Purchase History
We collect this data history from publicly available records. To have your information removed, we recommend requesting removal directly through your county’s website.
| Date | Buyer | Sale Price | Title Company |
|---|---|---|---|
| -- | -- | ||
| -- | -- | ||
| -- | -- | ||
| -- | -- | ||
| -- | -- | ||
| $269,900 | -- | ||
| $269,900 | -- | ||
| $114,000 | -- |
Mortgage History
We collect this data history from publicly available records. To have your information removed, we recommend requesting removal directly through your county’s website.
| Date | Status | Borrower | Loan Amount |
|---|---|---|---|
| Previous Owner | $40,000 | ||
| Previous Owner | $215,900 |
Tax History
We collect this data history from publicly available records. To have your information removed, we recommend requesting removal directly through your county’s website.
| Year | Tax Paid | Tax Assessment Tax Assessment Total Assessment is a certain percentage of the fair market value that is determined by local assessors to be the total taxable value of land and additions on the property. | Land | Improvement |
|---|---|---|---|---|
| 2025 | $4,698 | $427,900 | $197,500 | $230,400 |
| 2024 | $4,490 | $384,400 | $154,200 | $230,200 |
| 2023 | $4,154 | $345,300 | $140,200 | $205,100 |
| 2022 | $4,154 | $305,000 | $140,200 | $164,800 |
| 2021 | $4,165 | $297,500 | $140,200 | $157,300 |
| 2020 | $3,907 | $285,000 | $140,200 | $144,800 |
| 2019 | $3,880 | $286,100 | $142,200 | $143,900 |
| 2018 | $3,766 | $268,200 | $142,200 | $126,000 |
| 2017 | $3,570 | $255,400 | $142,200 | $113,200 |
| 2016 | $3,160 | $224,300 | $126,500 | $97,800 |
| 2015 | $3,073 | $224,300 | $126,500 | $97,800 |
| 2014 | $2,811 | $211,500 | $108,500 | $103,000 |
Map
- 2 Eddy St
- 15 Nanumett St
- 47 Nanumett St
- 12 Groveland St
- 3 Short Neck Rd
- 36B Starboard Dr Unit C
- 36B Starboard Dr Unit A
- 36B Starboard Dr Unit B
- 23 Starboard Dr Unit Lot 50
- 32 Starboard Dr Unit 32
- 29 Carleton St Unit 29
- 147 Onset Ave
- 147 /145 Onset Ave
- 3 Carleton St Unit 3
- 32 Carleton St Unit 32
- 17 Old Colony Ave
- 7 Grove St
- 35 Locust St
- 35 Locust St
- 24 Cove St
Ask me questions while you tour the home.