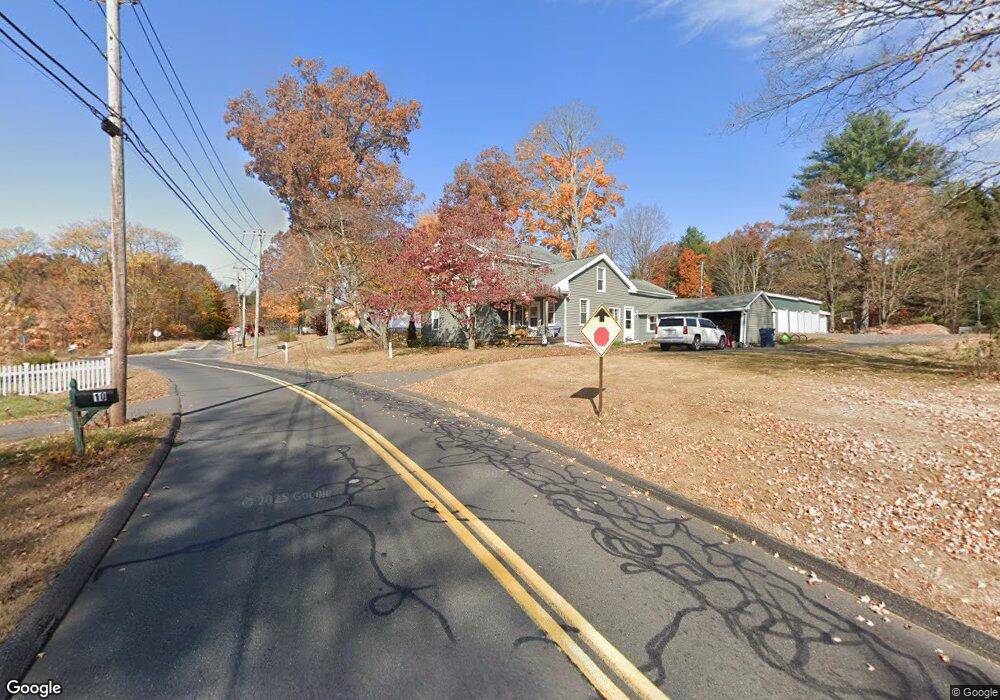
11 Matthews St Terryville, CT 06786
Estimated Value: $183,000 - $488,829
5
Beds
2
Baths
2,678
Sq Ft
$125/Sq Ft
Est. Value
About This Home
This home is located at 11 Matthews St, Terryville, CT 06786 and is currently estimated at $334,207, approximately $124 per square foot. 11 Matthews St is a home located in Litchfield County with nearby schools including Harry S. Fisher Elementary School, Eli Terry Jr. Middle School, and Terryville High School.
Ownership History
Date
Name
Owned For
Owner Type
Purchase Details
Closed on
Feb 6, 2007
Sold by
Gaylord Cyrus P
Bought by
Whitford George L and Whitford Paula M
Current Estimated Value
Create a Home Valuation Report for This Property
The Home Valuation Report is an in-depth analysis detailing your home's value as well as a comparison with similar homes in the area
Home Values in the Area
Average Home Value in this Area
Purchase History
| Date | Buyer | Sale Price | Title Company |
|---|---|---|---|
| Whitford George L | $100,000 | -- | |
| Whitford George L | $100,000 | -- |
Source: Public Records
Tax History Compared to Growth
Tax History
| Year | Tax Paid | Tax Assessment Tax Assessment Total Assessment is a certain percentage of the fair market value that is determined by local assessors to be the total taxable value of land and additions on the property. | Land | Improvement |
|---|---|---|---|---|
| 2025 | $9,008 | $227,640 | $96,530 | $131,110 |
| 2024 | $8,796 | $227,640 | $96,530 | $131,110 |
| 2023 | $8,582 | $227,640 | $96,530 | $131,110 |
| 2022 | $8,268 | $227,640 | $96,530 | $131,110 |
| 2021 | $8,717 | $214,550 | $111,510 | $103,040 |
| 2020 | $8,717 | $214,550 | $111,510 | $103,040 |
| 2019 | $8,717 | $214,550 | $111,510 | $103,040 |
| 2016 | $7,364 | $204,435 | $111,510 | $92,925 |
| 2015 | $7,243 | $204,435 | $111,510 | $92,925 |
| 2014 | $7,125 | $204,435 | $111,510 | $92,925 |
Source: Public Records
Map
Nearby Homes
- 17 Hoye St
- 21 Sandra Ave
- 2 Sandra Ave
- 140A E Plymouth Rd
- 565 Clark Ave Unit 18
- 565 Clark Ave Unit 70
- 85 Chippenwood Ln
- 14 Church St
- 19 Main St
- 7 Gillette Way
- 257 E Plymouth Rd
- 441 Clark Ave Unit 5
- 441 Clark Ave Unit 2
- 43A Hillside Ave
- 42 N Main St
- 7 Allen St
- Lots 16, 18 and 22 E Hill St
- 335 Pennwood Place
- 20 High St
- 12 Chestnut St