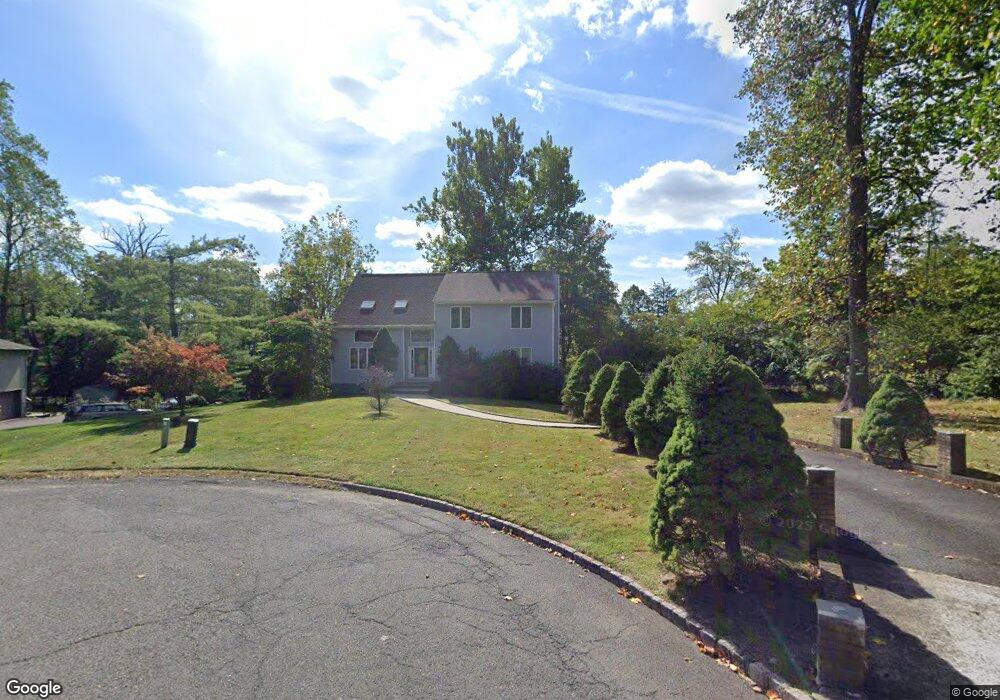
11 Maxwell Ct Warren, NJ 07059
Estimated Value: $984,383 - $1,156,000
Studio
--
Bath
3,084
Sq Ft
$349/Sq Ft
Est. Value
About This Home
This home is located at 11 Maxwell Ct, Warren, NJ 07059 and is currently estimated at $1,077,346, approximately $349 per square foot. 11 Maxwell Ct is a home located in Somerset County with nearby schools including Central School, Warren Middle School, and Watchung Hills Regional High School.
Ownership History
Date
Name
Owned For
Owner Type
Purchase Details
Closed on
Jun 24, 2021
Sold by
Quader Syed M and Quader Nazda I
Bought by
Quader Syed M and Quader Nazda I
Current Estimated Value
Home Financials for this Owner
Home Financials are based on the most recent Mortgage that was taken out on this home.
Original Mortgage
$327,328
Interest Rate
2.2%
Mortgage Type
New Conventional
Purchase Details
Closed on
Oct 26, 2004
Sold by
Bernier Lauredan
Bought by
Quader Syed M
Home Financials for this Owner
Home Financials are based on the most recent Mortgage that was taken out on this home.
Original Mortgage
$490,000
Interest Rate
5.74%
Purchase Details
Closed on
Jul 2, 1998
Sold by
Sneddon Maxwell
Bought by
Bernier Lauredan
Home Financials for this Owner
Home Financials are based on the most recent Mortgage that was taken out on this home.
Original Mortgage
$336,000
Interest Rate
6.98%
Create a Home Valuation Report for This Property
The Home Valuation Report is an in-depth analysis detailing your home's value as well as a comparison with similar homes in the area
Home Values in the Area
Average Home Value in this Area
Purchase History
| Date | Buyer | Sale Price | Title Company |
|---|---|---|---|
| Quader Syed M | -- | None Available | |
| Quader Syed M | -- | Land Title Services | |
| Quader Syed M | $700,000 | -- | |
| Bernier Lauredan | $420,000 | -- |
Source: Public Records
Mortgage History
| Date | Status | Borrower | Loan Amount |
|---|---|---|---|
| Previous Owner | Quader Syed M | $327,328 | |
| Previous Owner | Quader Syed M | $490,000 | |
| Previous Owner | Bernier Lauredan | $336,000 |
Source: Public Records
Tax History
| Year | Tax Paid | Tax Assessment Tax Assessment Total Assessment is a certain percentage of the fair market value that is determined by local assessors to be the total taxable value of land and additions on the property. | Land | Improvement |
|---|---|---|---|---|
| 2025 | $13,757 | $807,200 | $295,900 | $511,300 |
| 2024 | $13,757 | $748,500 | $271,100 | $477,400 |
Source: Public Records
Map
Nearby Homes
- 7 Sycamore Way
- 13 Sycamore Way
- 9 Apple Tree Ln
- 8 Cobblestone Ct
- 12 Jessica Ln
- 17 Helen St
- 15 Quail Run
- 302 Tiffany Way Unit 302
- 13 Deer Path Cir
- 17 Old Church Rd
- 112 King George Rd
- 26 Robin Glen Rd
- 14 Broadway Rd
- 1121 N Washington Ave
- 2 Willow Woods Trail
- 3 Concord Ct
- 11 Concord Ct
- 729 Mountain Blvd
- 22 Livingston Ave
- 59 Ferguson Rd
- 9 Maxwell Ct
- 74 Mount Bethel Rd
- 72 Mount Bethel Rd
- 76 Mount Bethel Rd
- 25 Cherry Tree Ln
- 7 Maxwell Ct
- 2 Sycamore Way
- 1 Sycamore Way
- 78 Mount Bethel Rd
- 70 Mount Bethel Rd
- 5 Maxwell Ct
- 4 Sycamore Way
- 84A Mount Bethel Rd
- 3 Sycamore Way
- 80 Mount Bethel Rd
- 68 Mount Bethel Rd
- 6 Sycamore Way
- 23 Cherry Tree Ln
- 73 Mount Bethel Rd
- 5 Sycamore Way
Your Personal Tour Guide
Ask me questions while you tour the home.