Estimated Value: $533,000 - $640,671
2
Beds
2
Baths
1,676
Sq Ft
$351/Sq Ft
Est. Value
About This Home
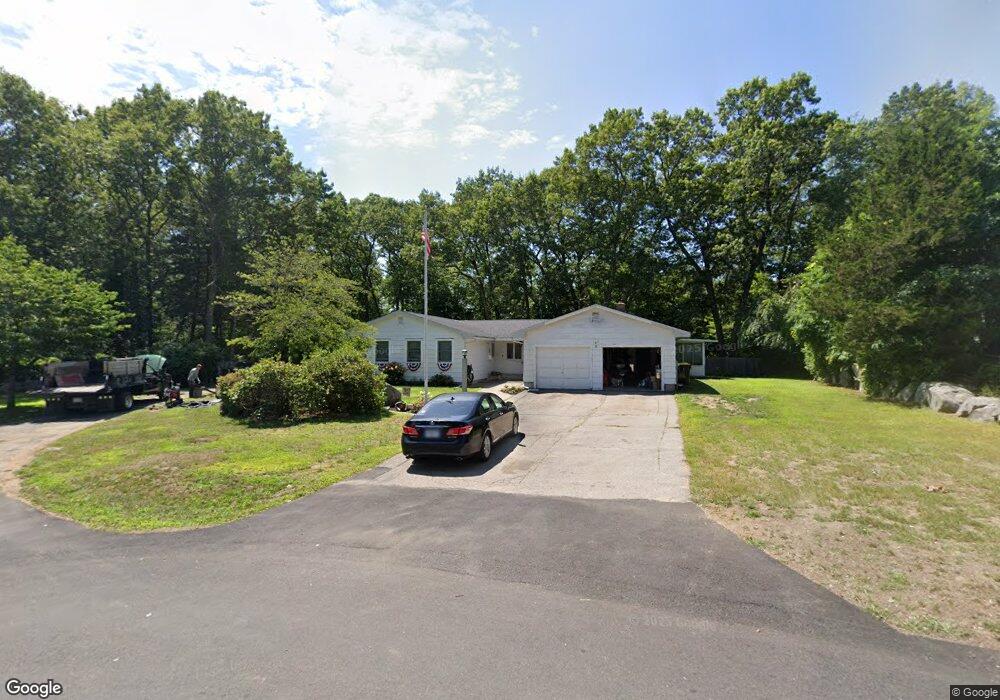
This home is located at 11 May Ave, Avon, MA 02322 and is currently estimated at $588,168, approximately $350 per square foot. 11 May Ave is a home located in Norfolk County with nearby schools including Ralph D. Butler Elementary School and Avon Middle/High School.
Ownership History
Date
Name
Owned For
Owner Type
Purchase Details
Closed on
Oct 29, 2021
Sold by
Mottau Robert E and Mottau Kate E
Bought by
Mottau Ft
Current Estimated Value
Purchase Details
Closed on
Apr 2, 2009
Sold by
Rose Daniel G and Clark Cynthia G
Bought by
Mottau Robert E and Mottau Kate E
Home Financials for this Owner
Home Financials are based on the most recent Mortgage that was taken out on this home.
Original Mortgage
$239,384
Interest Rate
4.92%
Mortgage Type
Purchase Money Mortgage
Purchase Details
Closed on
Nov 14, 2007
Sold by
Clark Cynthia G
Bought by
Clark Cynthia G and Rose Daniel G
Purchase Details
Closed on
Dec 1, 1997
Sold by
Rakutis Peal M
Bought by
Rose Daniel G
Home Financials for this Owner
Home Financials are based on the most recent Mortgage that was taken out on this home.
Original Mortgage
$108,000
Interest Rate
7.26%
Mortgage Type
Purchase Money Mortgage
Create a Home Valuation Report for This Property
The Home Valuation Report is an in-depth analysis detailing your home's value as well as a comparison with similar homes in the area
Home Values in the Area
Average Home Value in this Area
Purchase History
| Date | Buyer | Sale Price | Title Company |
|---|---|---|---|
| Mottau Ft | -- | None Available | |
| Mottau Robert E | $210,000 | -- | |
| Clark Cynthia G | -- | -- | |
| Rose Daniel G | $135,000 | -- |
Source: Public Records
Mortgage History
| Date | Status | Borrower | Loan Amount |
|---|---|---|---|
| Previous Owner | Rose Daniel G | $217,524 | |
| Previous Owner | Mottau Robert E | $239,384 | |
| Previous Owner | Rose Daniel G | $108,000 |
Source: Public Records
Tax History Compared to Growth
Tax History
| Year | Tax Paid | Tax Assessment Tax Assessment Total Assessment is a certain percentage of the fair market value that is determined by local assessors to be the total taxable value of land and additions on the property. | Land | Improvement |
|---|---|---|---|---|
| 2025 | $82 | $617,400 | $237,000 | $380,400 |
| 2024 | $7,420 | $528,900 | $215,100 | $313,800 |
| 2023 | $7,204 | $528,900 | $215,100 | $313,800 |
| 2022 | $7,367 | $466,000 | $179,100 | $286,900 |
| 2021 | $6,690 | $398,700 | $162,600 | $236,100 |
| 2020 | $7,227 | $408,300 | $159,500 | $248,800 |
| 2019 | $6,379 | $354,600 | $152,200 | $202,400 |
| 2018 | $6,481 | $349,400 | $152,200 | $197,200 |
| 2017 | $5,652 | $327,100 | $152,200 | $174,900 |
| 2016 | $5,621 | $328,500 | $144,900 | $183,600 |
| 2015 | $5,135 | $313,700 | $138,100 | $175,600 |
Source: Public Records
Map
Nearby Homes
- 50 Chestnut Rd
- 7 May Ave
- 45 Chestnut Rd
- 40 Chestnut Rd
- 1 May Ave
- 102 Highland St
- 76 Highland St
- 36 Chestnut Rd
- 106 Highland St
- 80 Highland St
- 68 Highland St
- 34 Walnut Terrace
- 22 Walnut Terrace
- 87 Highland St
- 81 Highland St
- 16 Walnut Terrace
- 121 Pond St
- 40 Walnut Terrace
- 10 Walnut Terrace
- 101 Highland St