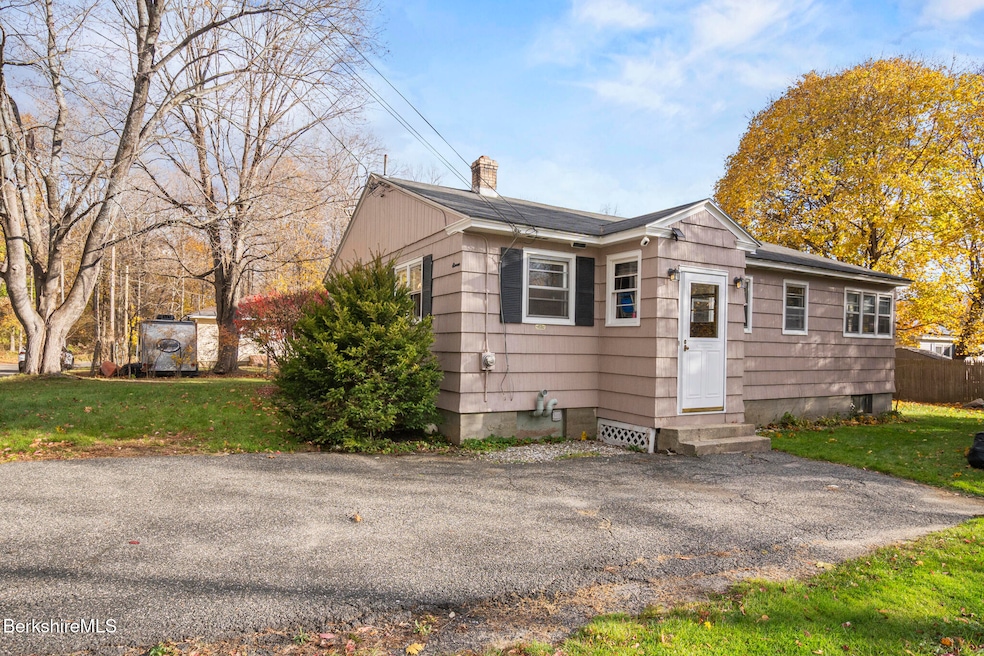
11 Mcallister St Pittsfield, MA 01201
Estimated payment $1,891/month
Highlights
- Deck
- Wood Flooring
- Granite Countertops
- Seasonal View
- Main Floor Bedroom
- Mature Landscaping
About This Home
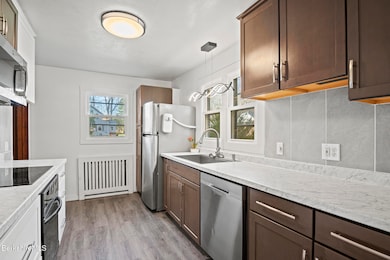
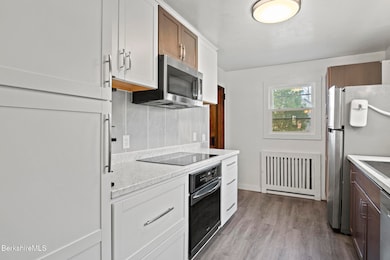
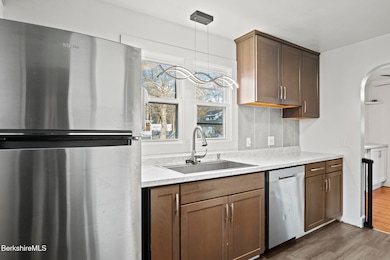
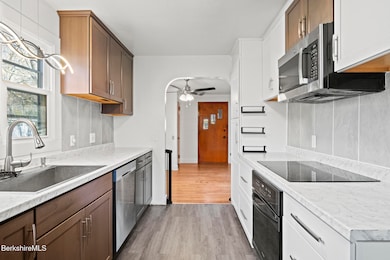
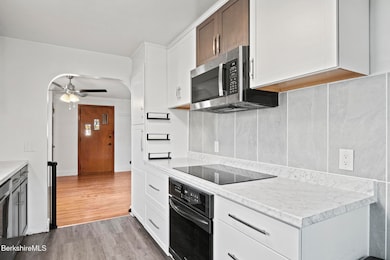
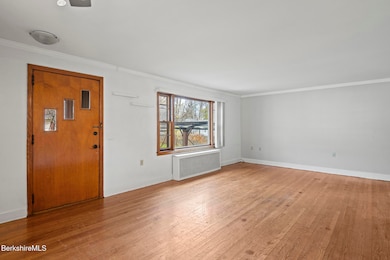
Welcome to this super cute and spacious 3-bed, 2-bath home nestled in desirable neighborhood. Inviting layout and thoughtful updates throughout. This home perfectly balances modern comfort and classic charm. Remodeled kitchen features stylish cabinetry, stainless steel appliances, a sleek tile backsplash, and marble-look countertops. Open dining area with built-ins connects seamlessly to the bright living room, where a large picture window fills the space with natural light. The refinished lower level offers a versatile bonus area complete with a bar setup and modern full bath, perfect for a family room, home office, gym, or guest suite. A separate updated laundry room adds convenience and organization. Enjoy the expansive yarda"plenty of space for outdoor dining, gardening or relaxing.
Home Details
Home Type
- Single Family
Est. Annual Taxes
- $3,818
Year Built
- 1950
Lot Details
- 7,405 Sq Ft Lot
- Lot Dimensions are 75 x 100
- Partially Fenced Property
- Mature Landscaping
- Privacy
- Landscaped with Trees
Home Design
- Wood Frame Construction
- Asphalt Shingled Roof
- Asbestos Siding
Interior Spaces
- 1,026 Sq Ft Home
- Seasonal Views
- Finished Basement
- Interior Basement Entry
- Storm Windows
Kitchen
- Range with Range Hood
- Microwave
- Dishwasher
- Granite Countertops
Flooring
- Wood
- Laminate
- Ceramic Tile
Bedrooms and Bathrooms
- 3 Bedrooms
- Main Floor Bedroom
- 2 Full Bathrooms
Laundry
- Laundry Room
- Dryer
- Washer
Parking
- 3 Parking Spaces
- No Garage
- Off-Street Parking
Outdoor Features
- Deck
- Exterior Lighting
- Porch
Schools
- Robert T. Capeless Elementary School
- John T Reid Middle School
- Taconic High School
Utilities
- High Efficiency Heating System
- Hot Water Heating System
- Boiler Heating System
- Heating System Uses Natural Gas
- Natural Gas Water Heater
- Water Heated On Demand
- Cable TV Available
Map
Home Values in the Area
Average Home Value in this Area
Tax History
| Year | Tax Paid | Tax Assessment Tax Assessment Total Assessment is a certain percentage of the fair market value that is determined by local assessors to be the total taxable value of land and additions on the property. | Land | Improvement |
|---|---|---|---|---|
| 2025 | $3,818 | $212,800 | $85,500 | $127,300 |
| 2024 | $3,797 | $205,800 | $85,500 | $120,300 |
| 2023 | $3,604 | $196,700 | $85,500 | $111,200 |
| 2022 | $3,328 | $179,300 | $85,500 | $93,800 |
| 2021 | $3,163 | $164,300 | $85,500 | $78,800 |
| 2020 | $2,718 | $137,900 | $61,800 | $76,100 |
| 2019 | $2,464 | $126,900 | $52,300 | $74,600 |
| 2018 | $2,377 | $125,400 | $52,300 | $73,100 |
| 2017 | $2,360 | $120,200 | $49,900 | $70,300 |
| 2016 | $2,292 | $122,200 | $49,900 | $72,300 |
| 2015 | $2,207 | $122,200 | $49,900 | $72,300 |
Property History
| Date | Event | Price | List to Sale | Price per Sq Ft |
|---|---|---|---|---|
| 11/06/2025 11/06/25 | For Sale | $299,900 | -- | $292 / Sq Ft |
Purchase History
| Date | Type | Sale Price | Title Company |
|---|---|---|---|
| Quit Claim Deed | $155,500 | -- | |
| Deed | $65,000 | -- | |
| Deed | $65,000 | -- |
Mortgage History
| Date | Status | Loan Amount | Loan Type |
|---|---|---|---|
| Open | $149,500 | New Conventional | |
| Closed | $149,500 | New Conventional | |
| Previous Owner | $8,200 | No Value Available | |
| Previous Owner | $115,000 | No Value Available |
Source: Berkshire County Board of REALTORS®
MLS Number: 248194
APN: PITT-000013G-000010-000011
Disclaimer: Certain information contained herein is derived from information provided by parties other than Homes.com. All information provided is deemed reliable, but is not guaranteed to be accurate and should be independently verified.
![]() IDX information is provided exclusively for consumers' personal, non-commercial use, that it may not be used for any purpose other than to identify prospective properties consumers may be interested in purchasing. Information deemed to be reliable but not guaranteed.
IDX information is provided exclusively for consumers' personal, non-commercial use, that it may not be used for any purpose other than to identify prospective properties consumers may be interested in purchasing. Information deemed to be reliable but not guaranteed.
The data relating to real estate for sale on this website comes from Berkshire County Board of Realtors and the Broker Reciprocity Program.
Copyright 2025 Berkshire County Board of Realtors. All rights reserved.
- 89 Pecks Rd
- 17 Taconic Park Dr
- 1404 North St
- 81 Linden St
- 83 Sadler Ave Unit 83 sadler
- 324 North St
- 105 Parker St Unit 3
- 44 Robbins Ave
- 44 Robbins Ave
- 44 Robbins Ave
- 6 Cherry St Unit 6A
- 34 Depot St
- 305 Springside Ave
- 5 Dewey Ave
- 7 North St
- 10 Wendell Avenue Extension
- 20 Bank Row
- 99 Hawthorne Ave
- 5 Whipple St
- 57 Bartlett Ave
