
Seller's Agent in 2025
Pressley Lawrence
Ferraro Realty LLC
(207) 577-5459
5 in this area
38 Total Sales
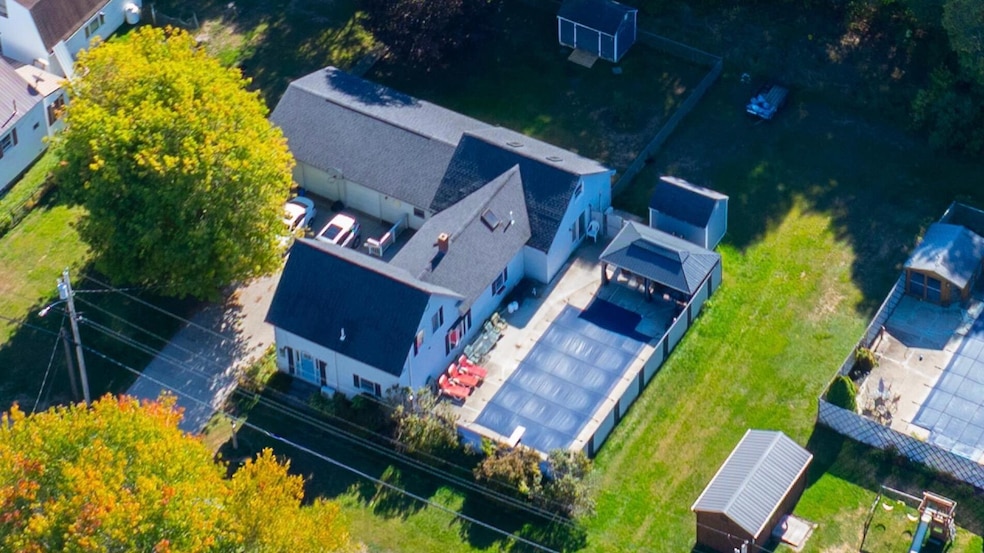
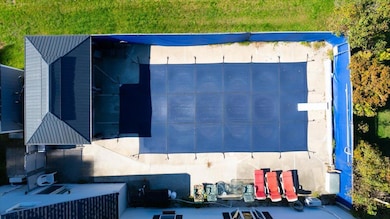
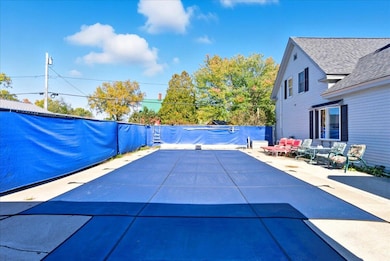
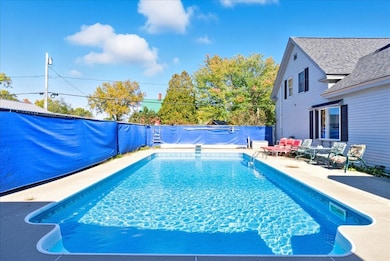
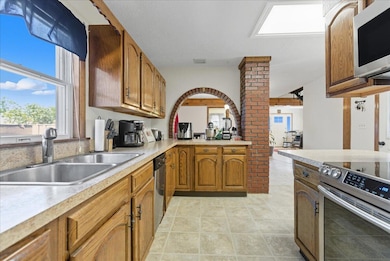
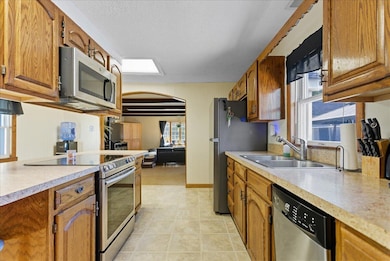
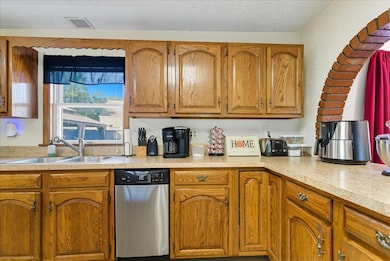
11. McClellan. St., Lisbon! A Charming 3-4 Bedroom New Englander that has been well maintained and is full of character. This spacious home offers flexible living with 3-4 bedrooms, 2 full baths, and multiple living areas including a dining room, large kitchen, living room, and family room. Features include two custom staircases, ample storage throughout, and so much more! Enjoy year round convenience with a heated, oversized 2 car attached garage offering direct entry into a large mudroom! The backyard is ideal for entertaining with an in-ground pool with a gazebo, and plenty of space to relax! Located in a quiet neighborhood close to all amenities. A versatile floor plan and fantastic outdoor features make this home a must-see!
Last Agent to Sell the Property
Ferraro Realty LLC Brokerage Email: Toni@Ferraro-Realty.com Listed on: 10/01/2025
| Date | Type | Sale Price | Title Company |
|---|---|---|---|
| Warranty Deed | $415,000 | -- | |
| Warranty Deed | -- | None Available |
| Date | Status | Loan Amount | Loan Type |
|---|---|---|---|
| Open | $407,483 | FHA | |
| Previous Owner | $201,465 | FHA |
| Date | Event | Price | List to Sale | Price per Sq Ft |
|---|---|---|---|---|
| 11/24/2025 11/24/25 | Sold | $415,000 | 0.0% | $176 / Sq Ft |
| 10/21/2025 10/21/25 | Price Changed | $415,000 | -2.4% | $176 / Sq Ft |
| 10/01/2025 10/01/25 | For Sale | $425,000 | -- | $180 / Sq Ft |
| Year | Tax Paid | Tax Assessment Tax Assessment Total Assessment is a certain percentage of the fair market value that is determined by local assessors to be the total taxable value of land and additions on the property. | Land | Improvement |
|---|---|---|---|---|
| 2025 | $5,427 | $314,600 | $50,100 | $264,500 |
| 2024 | $4,279 | $314,600 | $50,100 | $264,500 |
| 2023 | $3,828 | $181,400 | $33,100 | $148,300 |
| 2022 | $4,190 | $181,400 | $33,100 | $148,300 |
| 2021 | $4,009 | $181,400 | $33,100 | $148,300 |
| 2020 | $4,190 | $181,400 | $33,100 | $148,300 |
| 2019 | $3,728 | $181,400 | $33,100 | $148,300 |
| 2018 | $3,396 | $156,700 | $28,800 | $127,900 |
| 2017 | $3,171 | $156,700 | $28,800 | $127,900 |
| 2016 | $3,174 | $156,700 | $28,800 | $127,900 |
| 2015 | $2,935 | $133,100 | $32,000 | $101,100 |
| 2014 | $3,038 | $133,100 | $32,000 | $101,100 |
| 2013 | -- | $133,100 | $32,000 | $101,100 |
Seller's Agent in 2025
Pressley Lawrence
Ferraro Realty LLC
(207) 577-5459
5 in this area
38 Total Sales
Buyer's Agent in 2025
Kristin Rofe
Dream Home Realty LLC
(207) 615-2167
1 in this area
69 Total Sales
Source: Maine Listings
MLS Number: 1639362
APN: LISN-000019U-000000-000003
Disclaimer: Certain information contained herein is derived from information provided by parties other than Homes.com. All information provided is deemed reliable, but is not guaranteed to be accurate and should be independently verified.
![]() Listing data is derived in whole or in part from Maine Real Estate Information System, Inc. (d/b/a Maine Listings) and is for consumers' personal, noncommercial use only. Dimensions are approximate and not guaranteed. All data should be independently verified.
Listing data is derived in whole or in part from Maine Real Estate Information System, Inc. (d/b/a Maine Listings) and is for consumers' personal, noncommercial use only. Dimensions are approximate and not guaranteed. All data should be independently verified.
© 2026 Maine Real Estate Information System, Inc. All Rights Reserved. Equal Housing Opportunity.
Homes.com, LLC, 17600 Laguna Canyon Rd Irvine, CA 92618 (888)-952-6393
![]()
Ask me questions while you tour the home.