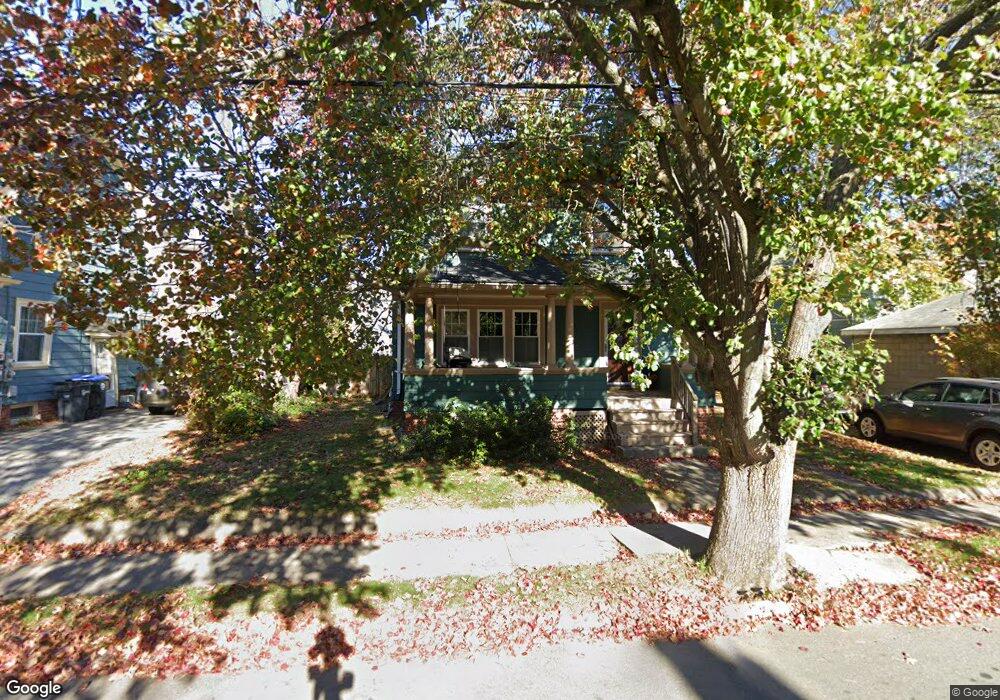
11 Memorial Rd Providence, RI 02906
Estimated Value: $692,000 - $760,362
3
Beds
2
Baths
1,855
Sq Ft
$396/Sq Ft
Est. Value
About This Home
This home is located at 11 Memorial Rd, Providence, RI 02906 and is currently estimated at $735,341, approximately $396 per square foot. 11 Memorial Rd is a home located in Providence County with nearby schools including Jewish Community Day School Of Rhode Island, Moses Brown School, and Montessori Childrens House.
Ownership History
Date
Name
Owned For
Owner Type
Purchase Details
Closed on
Oct 9, 2015
Sold by
Orourke Richard T and Orourke Elizabeth T
Bought by
Orourke Ft and Orourke Richard T
Current Estimated Value
Purchase Details
Closed on
Oct 26, 2006
Sold by
Schlosberg Eleanor C E
Bought by
Orourke Sarah
Home Financials for this Owner
Home Financials are based on the most recent Mortgage that was taken out on this home.
Original Mortgage
$150,000
Interest Rate
6.48%
Mortgage Type
Purchase Money Mortgage
Purchase Details
Closed on
Dec 23, 1999
Sold by
Parcel One Dev Assoc
Bought by
Union Station Parking
Home Financials for this Owner
Home Financials are based on the most recent Mortgage that was taken out on this home.
Original Mortgage
$1,512,500
Interest Rate
7.61%
Create a Home Valuation Report for This Property
The Home Valuation Report is an in-depth analysis detailing your home's value as well as a comparison with similar homes in the area
Purchase History
| Date | Buyer | Sale Price | Title Company |
|---|---|---|---|
| Orourke Ft | -- | -- | |
| Orourke Sarah | $200,000 | -- | |
| Union Station Parking | $15,500 | -- |
Source: Public Records
Mortgage History
| Date | Status | Borrower | Loan Amount |
|---|---|---|---|
| Previous Owner | Union Station Parking | $150,000 | |
| Previous Owner | Union Station Parking | $50,000 | |
| Previous Owner | Union Station Parking | $30,000 | |
| Previous Owner | Union Station Parking | $1,512,500 |
Source: Public Records
Tax History
| Year | Tax Paid | Tax Assessment Tax Assessment Total Assessment is a certain percentage of the fair market value that is determined by local assessors to be the total taxable value of land and additions on the property. | Land | Improvement |
|---|---|---|---|---|
| 2025 | $5,200 | $619,000 | $370,400 | $248,600 |
| 2024 | $9,371 | $510,700 | $249,600 | $261,100 |
| 2023 | $9,371 | $510,700 | $249,600 | $261,100 |
| 2022 | $9,090 | $510,700 | $249,600 | $261,100 |
| 2021 | $8,770 | $357,100 | $197,600 | $159,500 |
| 2020 | $8,770 | $357,100 | $197,600 | $159,500 |
| 2019 | $8,770 | $357,100 | $197,600 | $159,500 |
| 2018 | $10,857 | $339,700 | $171,000 | $168,700 |
| 2017 | $10,857 | $339,700 | $171,000 | $168,700 |
| 2016 | $10,857 | $339,700 | $171,000 | $168,700 |
| 2015 | $10,009 | $302,400 | $159,600 | $142,800 |
| 2014 | $10,206 | $302,400 | $159,600 | $142,800 |
| 2013 | $10,206 | $302,400 | $159,600 | $142,800 |
Source: Public Records
Map
Nearby Homes
Your Personal Tour Guide
Ask me questions while you tour the home.