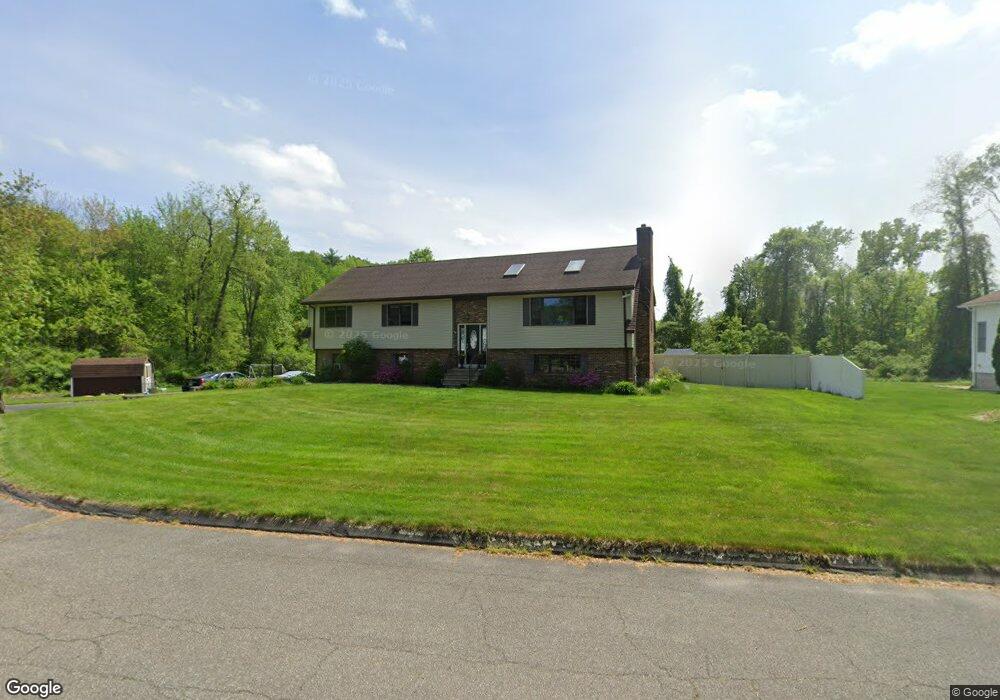
11 Memory Ln Feeding Hills, MA 01030
Estimated Value: $509,237 - $586,000
3
Beds
3
Baths
2,328
Sq Ft
$233/Sq Ft
Est. Value
About This Home
This home is located at 11 Memory Ln, Feeding Hills, MA 01030 and is currently estimated at $541,309, approximately $232 per square foot. 11 Memory Ln is a home located in Hampden County with nearby schools including Agawam Junior High School and Agawam High School.
Ownership History
Date
Name
Owned For
Owner Type
Purchase Details
Closed on
Jul 30, 2003
Sold by
Vachon Ronald Amie and Vachon Holly Marie
Bought by
Rondinelli Anthony and Rondinelli Kerry
Current Estimated Value
Home Financials for this Owner
Home Financials are based on the most recent Mortgage that was taken out on this home.
Original Mortgage
$156,000
Interest Rate
5.28%
Mortgage Type
Purchase Money Mortgage
Purchase Details
Closed on
Jul 31, 2001
Sold by
Cross Robert L and Cross Cynthia K
Bought by
Cachon Ronald Amie and Cachon Holly Marie
Home Financials for this Owner
Home Financials are based on the most recent Mortgage that was taken out on this home.
Original Mortgage
$204,250
Interest Rate
7.18%
Mortgage Type
Purchase Money Mortgage
Purchase Details
Closed on
Dec 10, 1996
Sold by
United Coop Bk
Bought by
Cross Robert L and Cross Cynthia K
Create a Home Valuation Report for This Property
The Home Valuation Report is an in-depth analysis detailing your home's value as well as a comparison with similar homes in the area
Home Values in the Area
Average Home Value in this Area
Purchase History
| Date | Buyer | Sale Price | Title Company |
|---|---|---|---|
| Rondinelli Anthony | $230,000 | -- | |
| Cachon Ronald Amie | $215,000 | -- | |
| Cross Robert L | $160,000 | -- |
Source: Public Records
Mortgage History
| Date | Status | Borrower | Loan Amount |
|---|---|---|---|
| Open | Cross Robert L | $134,900 | |
| Closed | Rondinelli Anthony | $156,000 | |
| Previous Owner | Cross Robert L | $204,250 | |
| Previous Owner | Cross Robert L | $74,500 | |
| Previous Owner | Cross Robert L | $50,000 |
Source: Public Records
Tax History
| Year | Tax Paid | Tax Assessment Tax Assessment Total Assessment is a certain percentage of the fair market value that is determined by local assessors to be the total taxable value of land and additions on the property. | Land | Improvement |
|---|---|---|---|---|
| 2025 | $6,850 | $467,900 | $148,700 | $319,200 |
| 2024 | $6,638 | $456,500 | $148,700 | $307,800 |
| 2023 | $6,508 | $412,400 | $126,200 | $286,200 |
| 2022 | $6,428 | $399,000 | $126,200 | $272,800 |
| 2021 | $5,976 | $355,700 | $117,300 | $238,400 |
| 2020 | $5,917 | $351,600 | $115,600 | $236,000 |
| 2019 | $5,551 | $333,400 | $113,400 | $220,000 |
| 2018 | $5,217 | $314,100 | $109,200 | $204,900 |
| 2017 | $4,960 | $304,100 | $109,200 | $194,900 |
| 2016 | $4,778 | $295,300 | $109,200 | $186,100 |
| 2015 | $4,717 | $299,700 | $109,200 | $190,500 |
Source: Public Records
Map
Nearby Homes
- 134 Hendom Dr
- 65 Hendom Dr
- 138 Elmar Dr
- 422 S Westfield St
- 91 Nicole Terrace
- 30 S Westfield St
- 180 Southwick St
- 21 Carmel Ln
- 74 White Fox Rd
- 387 Southwick St
- 534 S West St
- 390 Barry St
- 36-38 Orlando St
- 306 Feeding Hills Rd
- 511 Shoemaker Ln
- 1086 N Street Extension
- 100 Kensington St
- 67 Colemore St
- 74 Kensington St
- 19 Logan Place
Your Personal Tour Guide
Ask me questions while you tour the home.