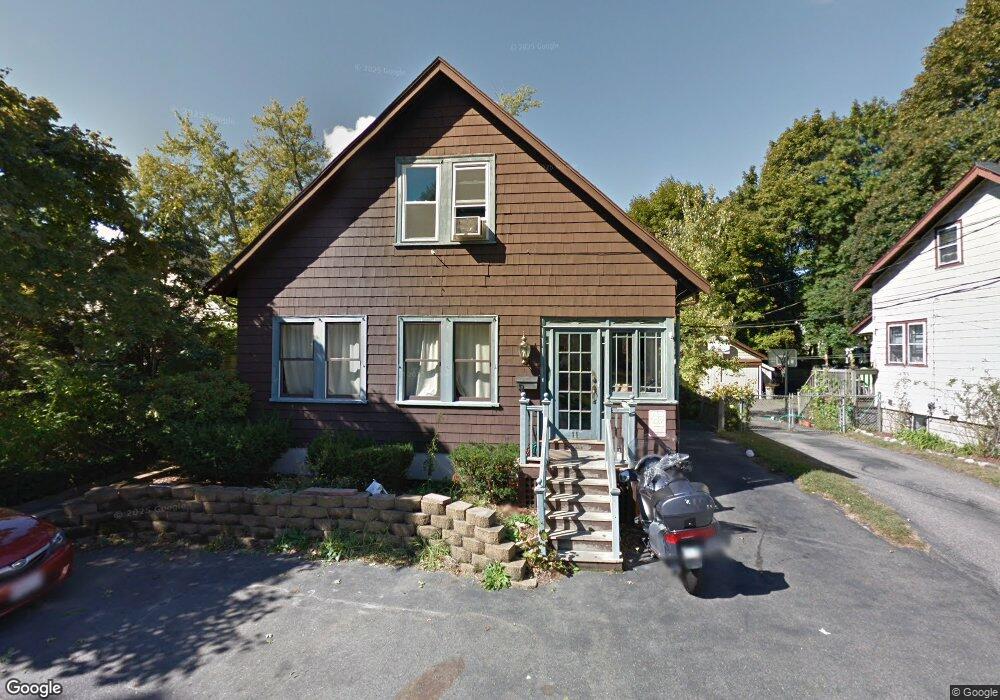
11 Meriam St Unit 11A Wakefield, MA 01880
Greenwood NeighborhoodEstimated Value: $813,633 - $975,000
3
Beds
2
Baths
2,374
Sq Ft
$378/Sq Ft
Est. Value
About This Home
This home is located at 11 Meriam St Unit 11A, Wakefield, MA 01880 and is currently estimated at $897,908, approximately $378 per square foot. 11 Meriam St Unit 11A is a home located in Middlesex County with nearby schools including Wakefield Memorial High School, St Joseph School, and St. Patrick Elementary School.
Ownership History
Date
Name
Owned For
Owner Type
Purchase Details
Closed on
May 31, 2000
Sold by
Lacroix Ray W and Lacroix Beulah F
Bought by
Lebo Brian D and Lebo Lisa P
Current Estimated Value
Home Financials for this Owner
Home Financials are based on the most recent Mortgage that was taken out on this home.
Original Mortgage
$310,500
Interest Rate
8.14%
Mortgage Type
Purchase Money Mortgage
Create a Home Valuation Report for This Property
The Home Valuation Report is an in-depth analysis detailing your home's value as well as a comparison with similar homes in the area
Home Values in the Area
Average Home Value in this Area
Purchase History
| Date | Buyer | Sale Price | Title Company |
|---|---|---|---|
| Lebo Brian D | $345,000 | -- |
Source: Public Records
Mortgage History
| Date | Status | Borrower | Loan Amount |
|---|---|---|---|
| Open | Lebo Brian D | $575,000 | |
| Closed | Lebo Brian D | $304,000 | |
| Closed | Lebo Brian D | $310,500 | |
| Previous Owner | Lebo Brian D | $20,000 |
Source: Public Records
Tax History Compared to Growth
Tax History
| Year | Tax Paid | Tax Assessment Tax Assessment Total Assessment is a certain percentage of the fair market value that is determined by local assessors to be the total taxable value of land and additions on the property. | Land | Improvement |
|---|---|---|---|---|
| 2025 | $7,984 | $703,400 | $362,900 | $340,500 |
| 2024 | $7,362 | $654,400 | $337,600 | $316,800 |
| 2023 | $7,166 | $610,900 | $315,100 | $295,800 |
| 2022 | $6,719 | $545,400 | $281,300 | $264,100 |
| 2021 | $6,390 | $502,000 | $257,200 | $244,800 |
| 2020 | $6,008 | $470,500 | $241,100 | $229,400 |
| 2019 | $5,636 | $439,300 | $225,000 | $214,300 |
| 2018 | $5,434 | $419,600 | $215,000 | $204,600 |
| 2017 | $5,109 | $392,100 | $200,900 | $191,200 |
| 2016 | $5,223 | $387,200 | $198,400 | $188,800 |
| 2015 | $4,878 | $361,900 | $185,400 | $176,500 |
| 2014 | $4,511 | $353,000 | $180,800 | $172,200 |
Source: Public Records
Map
Nearby Homes
- 772 Main St Unit 2
- 762 Main St
- 1 Sidney St
- 61 Forest St
- 3 Hickory Hill Rd Unit 1
- 9 Lovis Ave
- 6 Lovis Ave
- 12 Lovis Ave
- 24 Myrtle Ave
- 134 Nahant St Unit B
- 19 Fellsmere Ave
- 38 Bennett St Unit 3D
- 69 Foundry St Unit 416
- 62 Foundry St Unit 310
- 62 Foundry St Unit 312
- 62 Foundry St Unit 204
- 62 Foundry St Unit 202
- 62 Foundry St Unit 208
- 62 Foundry St Unit 414
- 62 Foundry St Unit 313