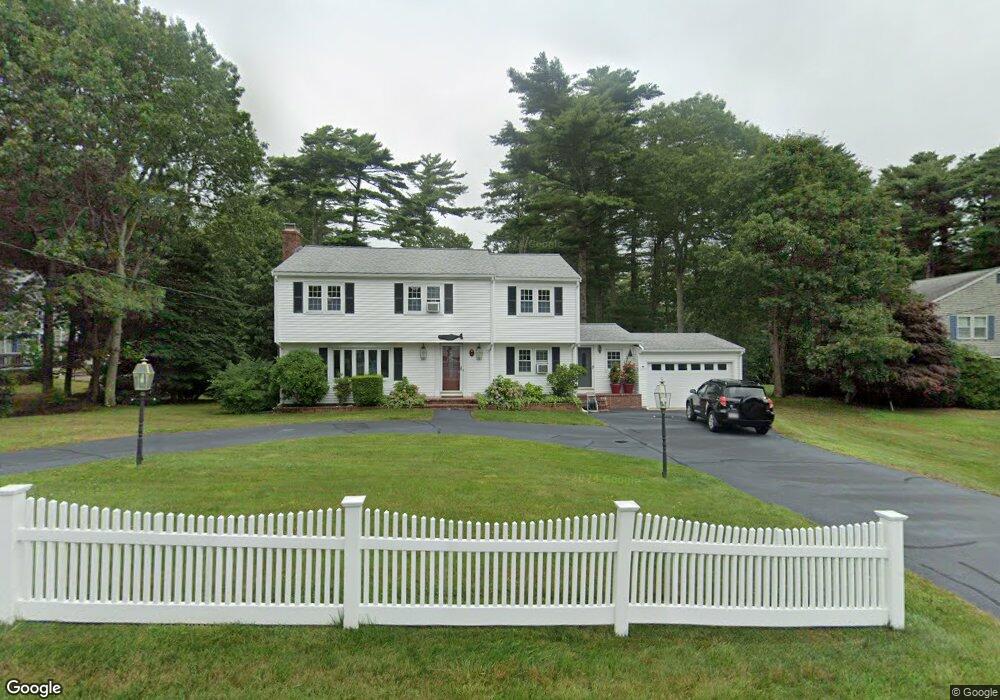
11 Midway Rd Pocasset, MA 02559
Monument Beach NeighborhoodEstimated Value: $648,054 - $759,000
4
Beds
2
Baths
2,312
Sq Ft
$305/Sq Ft
Est. Value
About This Home
This home is located at 11 Midway Rd, Pocasset, MA 02559 and is currently estimated at $704,764, approximately $304 per square foot. 11 Midway Rd is a home located in Barnstable County with nearby schools including Bourne High School, Cadence Academy Preschool - Bourne, and St Margaret Regional School.
Ownership History
Date
Name
Owned For
Owner Type
Purchase Details
Closed on
Jul 13, 2009
Sold by
Helco Rt and Carsano
Bought by
Lombardo Mark J and Lombardo Sharon G
Current Estimated Value
Home Financials for this Owner
Home Financials are based on the most recent Mortgage that was taken out on this home.
Original Mortgage
$200,000
Interest Rate
4.93%
Mortgage Type
Purchase Money Mortgage
Create a Home Valuation Report for This Property
The Home Valuation Report is an in-depth analysis detailing your home's value as well as a comparison with similar homes in the area
Home Values in the Area
Average Home Value in this Area
Purchase History
| Date | Buyer | Sale Price | Title Company |
|---|---|---|---|
| Lombardo Mark J | $305,000 | -- | |
| Lombardo Mark J | $305,000 | -- |
Source: Public Records
Mortgage History
| Date | Status | Borrower | Loan Amount |
|---|---|---|---|
| Open | Lombardo Mark J | $194,299 | |
| Closed | Lombardo Mark J | $200,000 |
Source: Public Records
Tax History Compared to Growth
Tax History
| Year | Tax Paid | Tax Assessment Tax Assessment Total Assessment is a certain percentage of the fair market value that is determined by local assessors to be the total taxable value of land and additions on the property. | Land | Improvement |
|---|---|---|---|---|
| 2025 | $4,193 | $536,900 | $189,700 | $347,200 |
| 2024 | $4,100 | $511,200 | $180,600 | $330,600 |
| 2023 | $2,655 | $456,300 | $159,900 | $296,400 |
| 2022 | $2,551 | $376,700 | $141,500 | $235,200 |
| 2021 | $3,692 | $342,800 | $128,700 | $214,100 |
| 2020 | $3,581 | $333,400 | $127,500 | $205,900 |
| 2019 | $3,381 | $321,700 | $127,500 | $194,200 |
| 2018 | $3,231 | $306,500 | $121,500 | $185,000 |
| 2017 | $3,064 | $297,500 | $114,300 | $183,200 |
| 2016 | $2,728 | $268,500 | $114,300 | $154,200 |
| 2015 | $2,583 | $256,500 | $102,300 | $154,200 |
Source: Public Records
Map
Nearby Homes
- 566 Shore Rd
- 501 County Rd
- 515 County Rd
- 18 Douglas Ave
- 30 Howard Ave
- 39 Bennets Neck Dr
- 18 Carlton Rd
- 105 Clay Pond Rd
- 93 Valley Bars Rd
- 14 Navajo Rd
- 12 Beachwood Rd
- 709 County Rd
- 254 Barlows Landing Rd
- 174 Barlows Landing Rd
- 940 County Rd
- 2 Westerly Dr
- 203 County Rd
- 15 1st St
- 70 Wings Neck Rd
- 16 Amberwood Ct