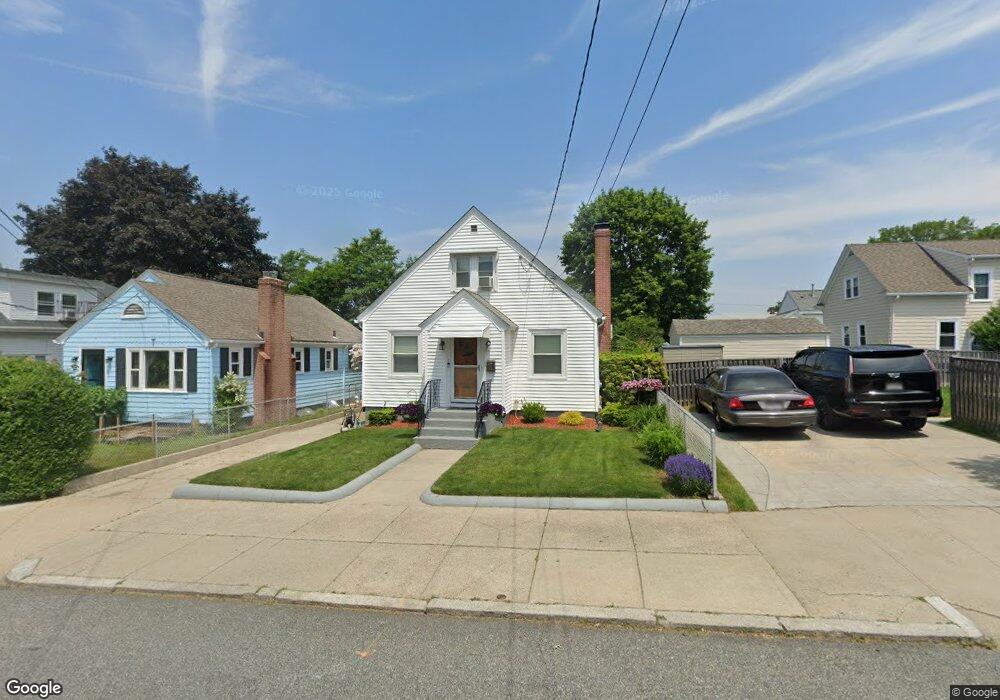
11 Mink Rd Providence, RI 02908
Elmhurst NeighborhoodEstimated Value: $379,000 - $456,000
3
Beds
2
Baths
1,357
Sq Ft
$304/Sq Ft
Est. Value
About This Home
This home is located at 11 Mink Rd, Providence, RI 02908 and is currently estimated at $412,396, approximately $303 per square foot. 11 Mink Rd is a home located in Providence County with nearby schools including St. Pius V Catholic School, St. Augustine School, and La Salle Academy.
Ownership History
Date
Name
Owned For
Owner Type
Purchase Details
Closed on
Sep 25, 2020
Sold by
Marcoccio Marie C
Bought by
Rossi Anthony J
Current Estimated Value
Home Financials for this Owner
Home Financials are based on the most recent Mortgage that was taken out on this home.
Original Mortgage
$112,520
Outstanding Balance
$90,177
Interest Rate
2.9%
Mortgage Type
New Conventional
Estimated Equity
$322,219
Purchase Details
Closed on
Jan 28, 2011
Sold by
Marcoccio Marie C
Bought by
Marcoccio Marie C and Rossi Patricia
Create a Home Valuation Report for This Property
The Home Valuation Report is an in-depth analysis detailing your home's value as well as a comparison with similar homes in the area
Home Values in the Area
Average Home Value in this Area
Purchase History
| Date | Buyer | Sale Price | Title Company |
|---|---|---|---|
| Rossi Anthony J | $116,000 | None Available | |
| Marcoccio Marie C | -- | None Available | |
| Marcoccio Marie C | -- | -- |
Source: Public Records
Mortgage History
| Date | Status | Borrower | Loan Amount |
|---|---|---|---|
| Open | Marcoccio Marie C | $112,520 | |
| Closed | Rossi Anthony J | $112,520 |
Source: Public Records
Tax History
| Year | Tax Paid | Tax Assessment Tax Assessment Total Assessment is a certain percentage of the fair market value that is determined by local assessors to be the total taxable value of land and additions on the property. | Land | Improvement |
|---|---|---|---|---|
| 2025 | $3,118 | $371,200 | $159,800 | $211,400 |
| 2024 | $5,202 | $283,500 | $103,900 | $179,600 |
| 2023 | $5,202 | $283,500 | $103,900 | $179,600 |
| 2022 | $5,046 | $283,500 | $103,900 | $179,600 |
| 2021 | $4,949 | $201,500 | $79,200 | $122,300 |
| 2020 | $4,949 | $201,500 | $79,200 | $122,300 |
| 2019 | $4,949 | $201,500 | $79,200 | $122,300 |
| 2018 | $5,034 | $157,500 | $63,700 | $93,800 |
| 2017 | $5,034 | $157,500 | $63,700 | $93,800 |
| 2016 | $5,034 | $157,500 | $63,700 | $93,800 |
| 2015 | $4,624 | $139,700 | $63,700 | $76,000 |
| 2014 | $4,715 | $139,700 | $63,700 | $76,000 |
| 2013 | $4,715 | $139,700 | $63,700 | $76,000 |
Source: Public Records
Map
Nearby Homes
- 39 Hillview Ave
- 797 Academy Ave
- 36 Walton St
- 68 Enfield Ave
- 84 Enfield Ave
- 616 River Ave
- 299 Jastram St
- 835 River Ave
- 0 Wainwright St
- 160 Cumberland St
- 25 Hymer St
- 115 Hazael St
- 73 Wainwright St
- 1189 Smith St
- 36 Hereford St
- 876 Douglas Ave
- 860 Douglas Ave
- 1196 Smith St
- 46 Longwood Ave
- 112 Longwood Ave
Your Personal Tour Guide
Ask me questions while you tour the home.