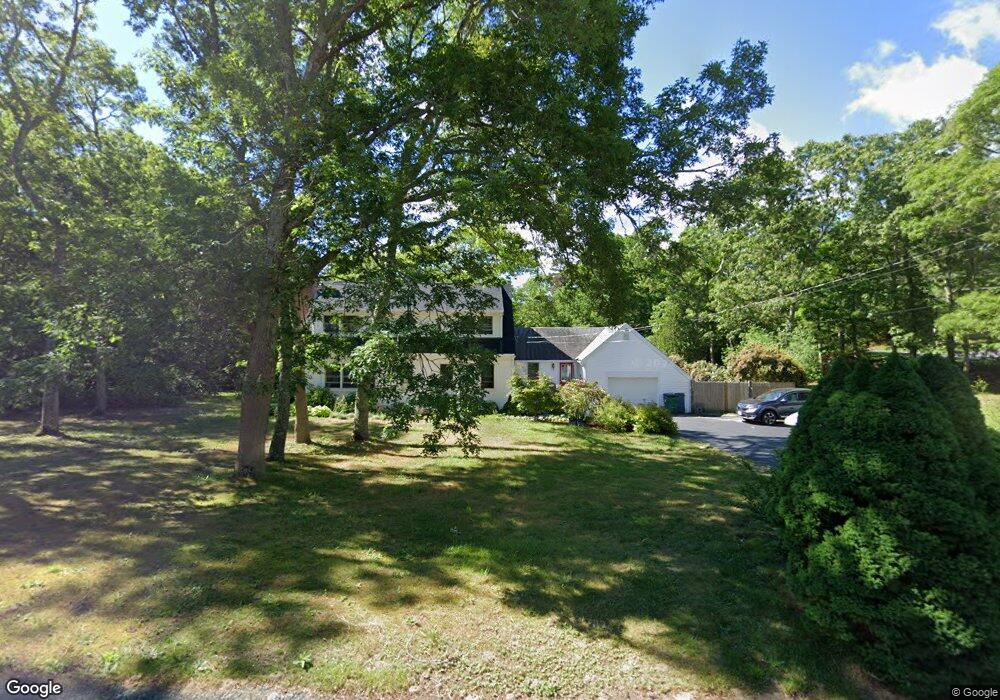
11 Minton Ln West Barnstable, MA 02668
West Barnstable NeighborhoodEstimated Value: $710,000 - $881,000
3
Beds
2
Baths
2,138
Sq Ft
$366/Sq Ft
Est. Value
About This Home
This home is located at 11 Minton Ln, West Barnstable, MA 02668 and is currently estimated at $781,501, approximately $365 per square foot. 11 Minton Ln is a home located in Barnstable County with nearby schools including Barnstable United Elementary School, West Barnstable Elementary School, and Barnstable Intermediate School.
Ownership History
Date
Name
Owned For
Owner Type
Purchase Details
Closed on
Jan 8, 2019
Sold by
Russi Loretta J and Russi Patrick G
Bought by
Russi Patrick G and Russi Loretta J
Current Estimated Value
Purchase Details
Closed on
Aug 21, 2000
Sold by
Seth Parker Rt
Bought by
Kuhn Christopher P
Create a Home Valuation Report for This Property
The Home Valuation Report is an in-depth analysis detailing your home's value as well as a comparison with similar homes in the area
Home Values in the Area
Average Home Value in this Area
Purchase History
| Date | Buyer | Sale Price | Title Company |
|---|---|---|---|
| Russi Patrick G | -- | -- | |
| Kuhn Christopher P | $15,000 | -- |
Source: Public Records
Tax History
| Year | Tax Paid | Tax Assessment Tax Assessment Total Assessment is a certain percentage of the fair market value that is determined by local assessors to be the total taxable value of land and additions on the property. | Land | Improvement |
|---|---|---|---|---|
| 2025 | $5,521 | $682,500 | $176,300 | $506,200 |
| 2024 | $5,149 | $659,300 | $176,300 | $483,000 |
| 2023 | $4,921 | $590,100 | $160,300 | $429,800 |
| 2022 | $4,644 | $481,700 | $118,800 | $362,900 |
| 2021 | $4,550 | $433,700 | $118,800 | $314,900 |
| 2020 | $4,653 | $424,500 | $118,800 | $305,700 |
| 2019 | $4,434 | $393,100 | $118,800 | $274,300 |
| 2018 | $4,112 | $366,500 | $125,000 | $241,500 |
| 2017 | $3,837 | $356,600 | $125,000 | $231,600 |
| 2016 | $3,843 | $352,600 | $125,000 | $227,600 |
| 2015 | $3,794 | $349,700 | $124,000 | $225,700 |
Source: Public Records
Map
Nearby Homes
- 29 Appaloosa Way
- 49 Great Hill Dr
- 16 Morgan Way
- 324 Patriot Way
- 74 Saddler Ln
- 146 Hillside Dr
- 900 Old Stage Rd
- 89 Moco Rd
- 282 Parker Rd
- 37 Ansel Howland Rd
- 52 Windlass Ln
- 350 Plum St
- 367 Plum St
- 253 Gleneagle Dr
- 66 Tern Ln
- 73 Tern Ln
- 169 Cedric Rd
- 80 Branch Terrace
- 117 Elijah Childs Ln
- 172 Skunknet Rd
- 0 Minton Ln
- 164 Great Hill Dr
- 71 Minton Ln
- 10 Minton Ln
- 171 Great Hill Dr
- 28 Minton Ln
- 151 Great Hill Dr
- 41 Biltmore Place
- 150 Great Hill Dr
- 55 Biltmore Place
- 6 Minton Ln
- 7 Minton Ln
- 42 Minton Ln
- 0 Biltmore Place
- 63 Biltmore Place
- 51 Biltmore Place
- 1601 Service Rd
- 134 Great Hill Dr
- 140 Minton Ln
- 139 Minton Ln
Your Personal Tour Guide
Ask me questions while you tour the home.