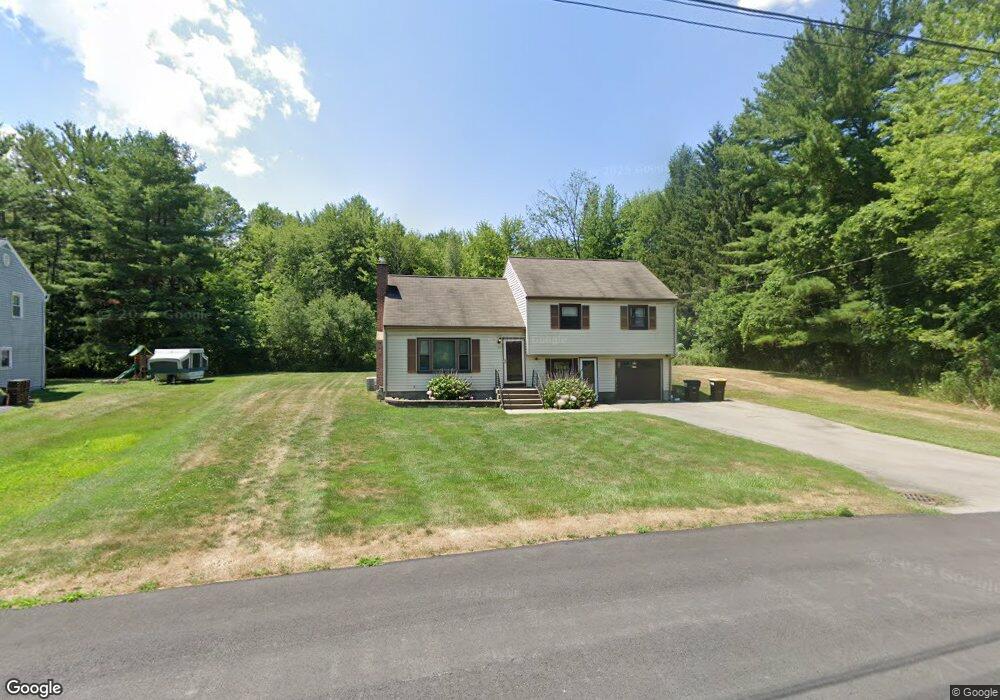
11 Montclair Dr Schenectady, NY 12302
Estimated Value: $329,000 - $384,000
4
Beds
2
Baths
1,708
Sq Ft
$211/Sq Ft
Est. Value
About This Home
This home is located at 11 Montclair Dr, Schenectady, NY 12302 and is currently estimated at $359,566, approximately $210 per square foot. 11 Montclair Dr is a home located in Schenectady County with nearby schools including Burnt Hills Ballston Lake Senior High School and Oak Hill School.
Ownership History
Date
Name
Owned For
Owner Type
Purchase Details
Closed on
Mar 1, 2019
Sold by
Smith Marisa and Keppler Thomas
Bought by
Keppler Thomas
Current Estimated Value
Purchase Details
Closed on
Jul 11, 2008
Sold by
Evertt Kelly Shaun E,Christine
Bought by
Smith Marisa
Home Financials for this Owner
Home Financials are based on the most recent Mortgage that was taken out on this home.
Original Mortgage
$207,113
Outstanding Balance
$130,210
Interest Rate
6.17%
Mortgage Type
FHA
Estimated Equity
$229,356
Create a Home Valuation Report for This Property
The Home Valuation Report is an in-depth analysis detailing your home's value as well as a comparison with similar homes in the area
Purchase History
We collect this data history from publicly available records. To have your information removed, we recommend requesting removal directly through your county’s website.
| Date | Buyer | Sale Price | Title Company |
|---|---|---|---|
| Keppler Thomas | -- | Old Republic Title Ris | |
| Smith Marisa | $208,750 | Rosemary Mc Kenna |
Source: Public Records
Mortgage History
We collect this data history from publicly available records. To have your information removed, we recommend requesting removal directly through your county’s website.
| Date | Status | Borrower | Loan Amount |
|---|---|---|---|
| Open | Smith Marisa | $207,113 |
Source: Public Records
Tax History
| Year | Tax Paid | Tax Assessment Tax Assessment Total Assessment is a certain percentage of the fair market value that is determined by local assessors to be the total taxable value of land and additions on the property. | Land | Improvement |
|---|---|---|---|---|
| 2025 | $2,494 | $180,900 | $30,100 | $150,800 |
| 2024 | $2,494 | $180,900 | $30,100 | $150,800 |
| 2023 | $25 | $180,900 | $30,100 | $150,800 |
| 2022 | $6,300 | $180,900 | $30,100 | $150,800 |
| 2021 | $6,136 | $180,900 | $30,100 | $150,800 |
| 2020 | $6,340 | $180,900 | $30,100 | $150,800 |
| 2019 | $2,439 | $180,900 | $30,100 | $150,800 |
| 2018 | $2,439 | $180,900 | $30,100 | $150,800 |
| 2017 | $5,864 | $180,900 | $30,100 | $150,800 |
| 2016 | $2,398 | $180,900 | $30,100 | $150,800 |
| 2015 | -- | $180,900 | $30,100 | $150,800 |
| 2014 | -- | $180,900 | $30,100 | $150,800 |
Source: Public Records
Map
Nearby Homes
- 116 Charlton Rd
- 2 Kendall Place
- 14 Wheeler Dr
- 45 Onderdonk Rd
- 19 Fredericks Rd
- 704 Swaggertown Rd
- 65 Pashley Rd
- 84 Pashley Rd
- 221 Droms Rd
- 19 Willow Ln
- 610 Saratoga Rd
- 119 Birch Ln
- 4 Country Fair Ln
- L12 Jane Dr
- 161 Willow Ln
- 709 Saratoga Rd
- 1 Dorothy Ln
- 98 Saint Stephens Ln W
- L8 Hetcheltown Rd
- L6 Hetcheltown Rd
Your Personal Tour Guide
Ask me questions while you tour the home.