Estimated Value: $456,000 - $631,000
3
Beds
3
Baths
1,220
Sq Ft
$435/Sq Ft
Est. Value
About This Home
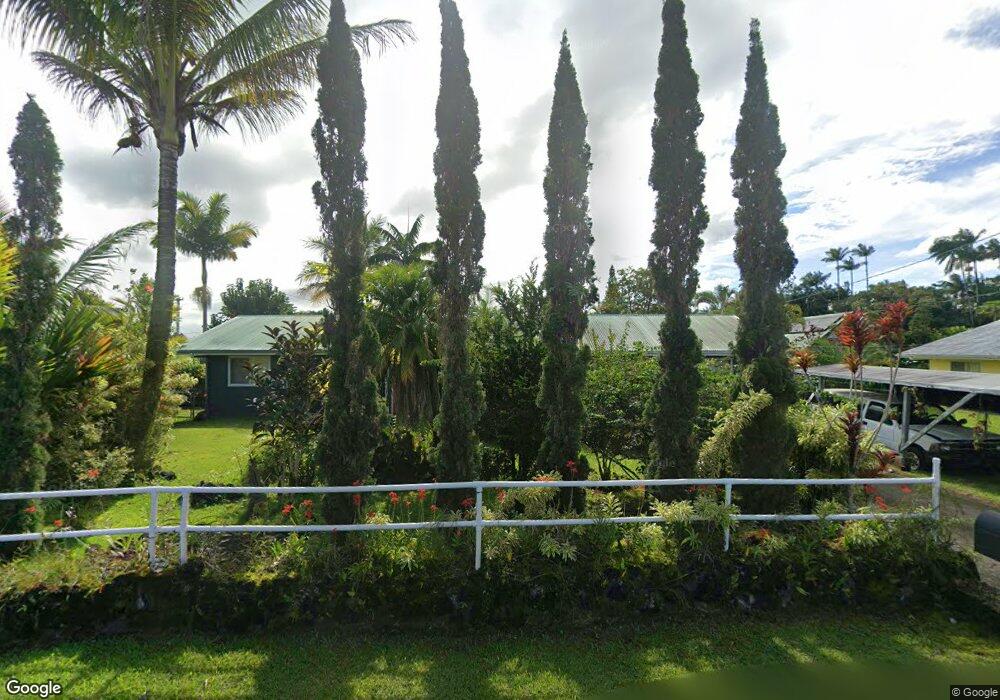
This home is located at 11 Mopua Place, Hilo, HI 96720 and is currently estimated at $530,224, approximately $434 per square foot. 11 Mopua Place is a home located in Hawaii County with nearby schools including Ka'umana Elementary School, Hilo Intermediate School, and Hilo High School.
Ownership History
Date
Name
Owned For
Owner Type
Purchase Details
Closed on
Mar 27, 2019
Sold by
Raagas Pratt Sr James Crighton and Raagas Pratt Nelia
Bought by
Raagas Pratt Sr James C and Raagas Pratt Nelia
Current Estimated Value
Purchase Details
Closed on
Jul 30, 2002
Sold by
Hjc Development Corp
Bought by
Raagas Pratt Sr James Crighton and Raagas Pratt Nelia
Home Financials for this Owner
Home Financials are based on the most recent Mortgage that was taken out on this home.
Original Mortgage
$133,000
Interest Rate
6.51%
Mortgage Type
Purchase Money Mortgage
Purchase Details
Closed on
Jun 19, 2000
Sold by
Norgard John A and Norgard Rosaline R
Bought by
Hjc Development Corp and E Mattos Investments Llc
Create a Home Valuation Report for This Property
The Home Valuation Report is an in-depth analysis detailing your home's value as well as a comparison with similar homes in the area
Home Values in the Area
Average Home Value in this Area
Purchase History
| Date | Buyer | Sale Price | Title Company |
|---|---|---|---|
| Raagas Pratt Sr James C | -- | None Available | |
| Raagas Pratt Sr James Crighton | $140,000 | -- | |
| Hjc Development Corp | $154,500 | Security Title Corporation |
Source: Public Records
Mortgage History
| Date | Status | Borrower | Loan Amount |
|---|---|---|---|
| Previous Owner | Raagas Pratt Sr James Crighton | $133,000 |
Source: Public Records
Tax History Compared to Growth
Tax History
| Year | Tax Paid | Tax Assessment Tax Assessment Total Assessment is a certain percentage of the fair market value that is determined by local assessors to be the total taxable value of land and additions on the property. | Land | Improvement |
|---|---|---|---|---|
| 2025 | $397 | $246,800 | $38,500 | $208,300 |
| 2024 | $397 | $239,600 | $38,500 | $201,100 |
| 2023 | $468 | $232,600 | $38,500 | $194,100 |
| 2022 | $496 | $225,800 | $38,500 | $187,300 |
| 2021 | $464 | $219,200 | $38,500 | $180,700 |
| 2020 | $432 | $212,800 | $38,500 | $174,300 |
| 2019 | $402 | $206,600 | $38,500 | $168,100 |
| 2018 | $372 | $200,600 | $38,500 | $162,100 |
| 2017 | $343 | $194,800 | $38,500 | $156,300 |
| 2016 | $27 | $189,100 | $38,500 | $150,600 |
| 2015 | $170 | $183,600 | $38,500 | $145,100 |
| 2014 | $170 | $178,300 | $38,500 | $139,800 |
Source: Public Records
Map
Nearby Homes
- 25 Wawai Loop
- 52 Wawai Loop
- 1162 Kaumana Dr
- 144 Chong St
- 7 Kaapuni Loop
- 956 Kaumana Dr
- 187 Hokulani St
- 883 Hele Mauna St
- 1360 Kaumana Dr
- 61 Pakalana St
- 24 Manu Place
- 0 Puainako St Extension Unit 720370
- 1379 Mele Manu St
- 0 Kukuau St Unit 721423
- 46 Kokea St
- 617 Ainako Ave Unit 1
- 60 Kapaa St
- 497 Makanaa St
- 1808 Waianuenue Ave
- 1706 Waianuenue Ave