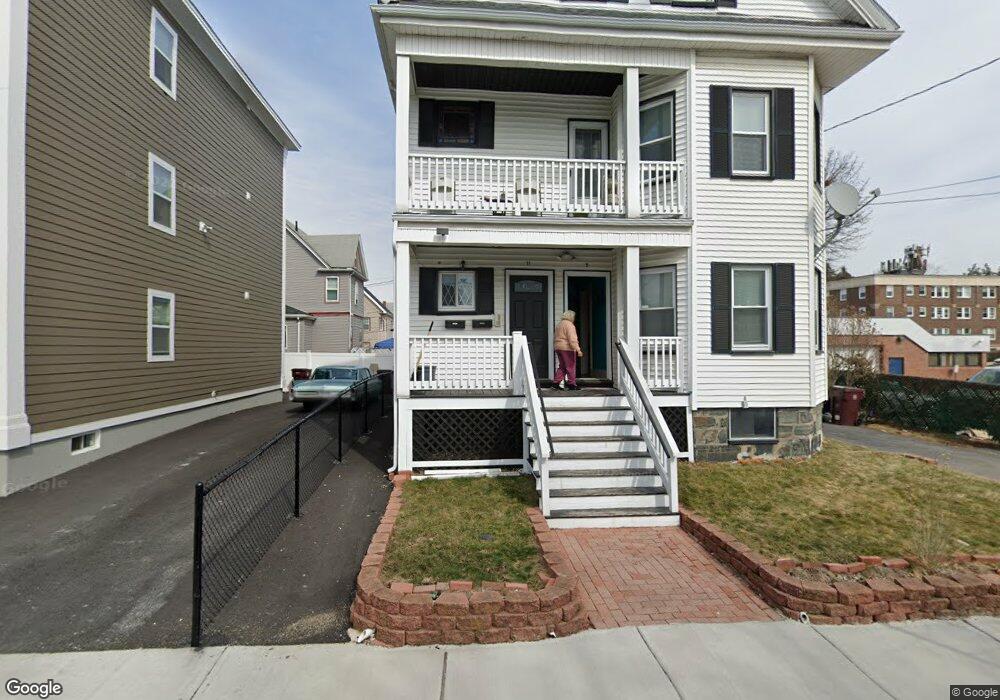
11 Morris St Everett, MA 02149
Glendale NeighborhoodEstimated Value: $800,951 - $946,000
5
Beds
2
Baths
2,305
Sq Ft
$385/Sq Ft
Est. Value
About This Home
This home is located at 11 Morris St, Everett, MA 02149 and is currently estimated at $887,488, approximately $385 per square foot. 11 Morris St is a home located in Middlesex County with nearby schools including Everett High School and Pioneer Charter School of Science.
Ownership History
Date
Name
Owned For
Owner Type
Purchase Details
Closed on
Oct 25, 2004
Sold by
Coffin Richard J
Bought by
Fisher Gloria and Fisher Joy
Current Estimated Value
Home Financials for this Owner
Home Financials are based on the most recent Mortgage that was taken out on this home.
Original Mortgage
$363,200
Outstanding Balance
$182,093
Interest Rate
5.85%
Mortgage Type
Purchase Money Mortgage
Estimated Equity
$705,395
Create a Home Valuation Report for This Property
The Home Valuation Report is an in-depth analysis detailing your home's value as well as a comparison with similar homes in the area
Home Values in the Area
Average Home Value in this Area
Purchase History
| Date | Buyer | Sale Price | Title Company |
|---|---|---|---|
| Fisher Gloria | $454,000 | -- |
Source: Public Records
Mortgage History
| Date | Status | Borrower | Loan Amount |
|---|---|---|---|
| Open | Fisher Gloria | $363,200 |
Source: Public Records
Tax History Compared to Growth
Tax History
| Year | Tax Paid | Tax Assessment Tax Assessment Total Assessment is a certain percentage of the fair market value that is determined by local assessors to be the total taxable value of land and additions on the property. | Land | Improvement |
|---|---|---|---|---|
| 2025 | $8,892 | $780,700 | $252,200 | $528,500 |
| 2024 | $8,151 | $711,300 | $224,200 | $487,100 |
| 2023 | $7,847 | $666,100 | $205,500 | $460,600 |
| 2022 | $6,444 | $622,000 | $196,100 | $425,900 |
| 2021 | $5,776 | $585,200 | $175,600 | $409,600 |
| 2020 | $5,972 | $561,300 | $175,600 | $385,700 |
| 2019 | $6,319 | $510,400 | $167,200 | $343,200 |
| 2018 | $6,175 | $448,100 | $145,700 | $302,400 |
| 2017 | $5,611 | $388,600 | $112,100 | $276,500 |
| 2016 | $5,183 | $358,700 | $112,100 | $246,600 |
| 2015 | $4,916 | $336,500 | $105,300 | $231,200 |
Source: Public Records
Map
Nearby Homes
- 8 Parker St Unit 8
- 21 Hillside Ave Unit 21
- 20 Fairmount St
- 378 Ferry St
- 132 Vernal St
- 21 Staples Ave Unit 26
- 21 Central Ave Unit 10
- 48 Cleveland Ave
- 39 Kinsman St
- 210 Hancock St
- 68 Linden St Unit 49
- 139 Bucknam St
- 859 Broadway Unit 15
- 46 Garland St
- 10 Clay Ave
- 99 Florence St
- 24 Corey St Unit 101
- 340 Main St
- 88 Garland St
- 55 Clarendon St
- 15 Morris St
- 15 Morris St Unit 3
- 15 Morris St Unit 2
- 45 Chestnut St
- 41 Chestnut St
- 19 Morris St
- 8 Morris St
- 10 Morris St Unit 3
- 10 Morris St Unit 1
- 1 Morris St Unit 2
- 1 Morris St
- 16 Morris St
- 37 Chestnut St
- 23 Morris St
- 20 Morris St
- 24 Morris St
- 27 Morris St
- 27 Morris St Unit 1
- 42 Chestnut St
- 33 Chestnut St