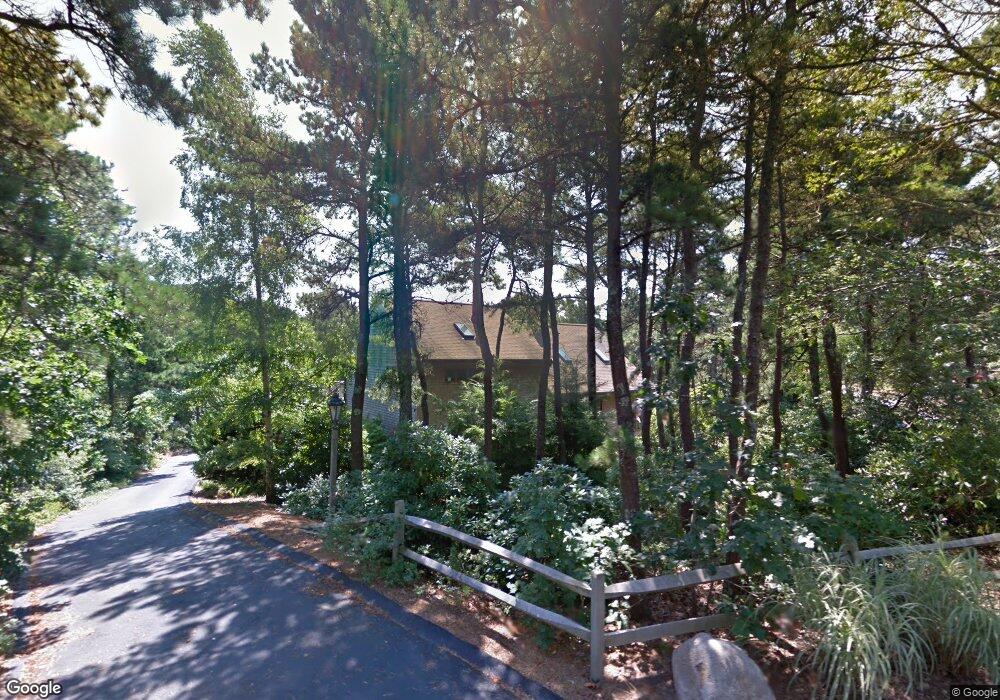
11 Moses Way North Truro, MA 2652
Estimated Value: $1,173,000 - $1,269,000
3
Beds
2
Baths
2,220
Sq Ft
$557/Sq Ft
Est. Value
About This Home
This home is located at 11 Moses Way, North Truro, MA 2652 and is currently estimated at $1,236,137, approximately $556 per square foot. 11 Moses Way is a home located in Barnstable County.
Ownership History
Date
Name
Owned For
Owner Type
Purchase Details
Closed on
Sep 27, 2011
Sold by
Crisara Muriel C and Ashley Shirley J
Bought by
Muriel Crisara Ret and Crisara Muriel
Current Estimated Value
Purchase Details
Closed on
May 26, 2004
Sold by
Holway Charles Russell and Holway Thompson Lee
Bought by
Crisara Muriel C and Ashley Shirley J
Purchase Details
Closed on
Nov 12, 1996
Sold by
Harnum Gladys C and Drown Uldine
Bought by
Crisara Muriel C and Ashley Shirley J
Create a Home Valuation Report for This Property
The Home Valuation Report is an in-depth analysis detailing your home's value as well as a comparison with similar homes in the area
Home Values in the Area
Average Home Value in this Area
Purchase History
| Date | Buyer | Sale Price | Title Company |
|---|---|---|---|
| Muriel Crisara Ret | -- | -- | |
| Crisara Muriel C | $1,250 | -- | |
| Crisara Muriel C | $7,500 | -- |
Source: Public Records
Tax History Compared to Growth
Tax History
| Year | Tax Paid | Tax Assessment Tax Assessment Total Assessment is a certain percentage of the fair market value that is determined by local assessors to be the total taxable value of land and additions on the property. | Land | Improvement |
|---|---|---|---|---|
| 2025 | $6,375 | $1,031,500 | $236,800 | $794,700 |
| 2024 | $6,003 | $1,002,100 | $234,500 | $767,600 |
| 2023 | $5,382 | $822,900 | $203,900 | $619,000 |
| 2022 | $4,933 | $638,100 | $175,700 | $462,400 |
| 2021 | $4,503 | $610,200 | $184,500 | $425,700 |
| 2020 | $4,469 | $609,700 | $182,700 | $427,000 |
| 2019 | $4,403 | $591,000 | $182,700 | $408,300 |
| 2018 | $4,112 | $557,900 | $182,700 | $375,200 |
| 2017 | $3,717 | $532,500 | $174,000 | $358,500 |
| 2016 | $3,752 | $554,200 | $198,100 | $356,100 |
| 2015 | $3,600 | $543,000 | $196,200 | $346,800 |
Source: Public Records
Map
Nearby Homes
- 14 N Union Field Rd
- 18 Hopkins Way
- 4 S Highland Rd Unit C
- 7 Fishermans Rd
- 7 Great Hollow Rd Unit 50
- 3 Bayberry Rd
- 25 Noons Dr
- 22 Shore Rd
- 7 Great Hollow Rd Unit 50
- 5 Sylvan Ln
- 2 Aldrich Rd
- 2 Amanda Ln
- 6 Professional Heights Rd Unit 1
- 72 Highland Rd
- 6 Long Nook Ln
- 23 Crestview Cir
- 27 Fishermans Rd
- 4 Highland Rd Unit C
- 4 Resolution Rd
- 35A Higgins Hollow Rd