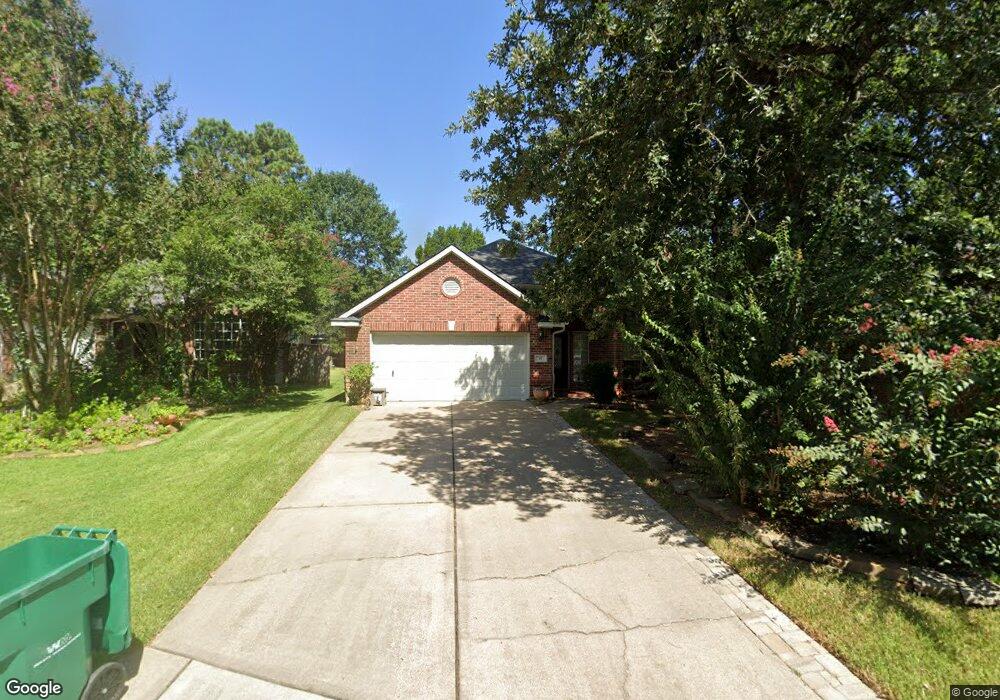
11 Mulberry Glen Place Spring, TX 77382
Alden Bridge NeighborhoodEstimated Value: $413,010 - $480,000
3
Beds
2
Baths
2,027
Sq Ft
$218/Sq Ft
Est. Value
About This Home
This home is located at 11 Mulberry Glen Place, Spring, TX 77382 and is currently estimated at $442,003, approximately $218 per square foot. 11 Mulberry Glen Place is a home located in Montgomery County with nearby schools including Buckalew Elementary School, Mitchell Intermediate School, and McCullough Junior High School.
Ownership History
Date
Name
Owned For
Owner Type
Purchase Details
Closed on
Jun 25, 2010
Sold by
Kretschmer William C and Kretschmer Carla H
Bought by
Suarez Hector Armando and Delos Rios Monica
Current Estimated Value
Home Financials for this Owner
Home Financials are based on the most recent Mortgage that was taken out on this home.
Original Mortgage
$196,355
Outstanding Balance
$130,950
Interest Rate
4.87%
Mortgage Type
FHA
Estimated Equity
$311,053
Purchase Details
Closed on
Jan 30, 1998
Sold by
The Ryland Group Inc
Bought by
Kretschmer William C and Kretschmer Carla H
Home Financials for this Owner
Home Financials are based on the most recent Mortgage that was taken out on this home.
Original Mortgage
$110,200
Interest Rate
7.07%
Purchase Details
Closed on
Sep 1, 1982
Sold by
Woodlands Land Dev Lp
Bought by
Suarez Hector Armando and Monica De Los Rios
Create a Home Valuation Report for This Property
The Home Valuation Report is an in-depth analysis detailing your home's value as well as a comparison with similar homes in the area
Home Values in the Area
Average Home Value in this Area
Purchase History
| Date | Buyer | Sale Price | Title Company |
|---|---|---|---|
| Suarez Hector Armando | -- | Stewart Title Of Montgomery | |
| Kretschmer William C | -- | Cornerstone Title Co | |
| Suarez Hector Armando | -- | -- |
Source: Public Records
Mortgage History
| Date | Status | Borrower | Loan Amount |
|---|---|---|---|
| Open | Suarez Hector Armando | $196,355 | |
| Previous Owner | Kretschmer William C | $110,200 |
Source: Public Records
Tax History Compared to Growth
Tax History
| Year | Tax Paid | Tax Assessment Tax Assessment Total Assessment is a certain percentage of the fair market value that is determined by local assessors to be the total taxable value of land and additions on the property. | Land | Improvement |
|---|---|---|---|---|
| 2025 | $3,299 | $380,893 | $50,000 | $330,893 |
| 2024 | $3,288 | $359,282 | -- | -- |
| 2023 | $3,288 | $326,620 | $50,000 | $327,030 |
| 2022 | $6,018 | $296,930 | $50,000 | $317,690 |
| 2021 | $5,888 | $269,940 | $24,220 | $245,720 |
| 2020 | $6,061 | $262,020 | $24,220 | $237,800 |
| 2019 | $5,744 | $240,650 | $24,220 | $216,430 |
| 2018 | $4,761 | $227,860 | $24,220 | $203,640 |
| 2017 | $5,613 | $232,320 | $24,220 | $208,100 |
| 2016 | $5,272 | $218,200 | $24,220 | $239,520 |
| 2015 | $4,189 | $198,360 | $24,220 | $200,250 |
| 2014 | $4,189 | $180,330 | $24,220 | $200,250 |
Source: Public Records
Map
Nearby Homes
- 2 E Sienna Place
- 71 N Acacia Park Cir
- 48 W New Avery Place
- 7 Coachman Ridge Place
- 129 Highland Dr
- 225 Fox Trotter
- 35 E Bellmeade Place
- 47 Crocus Petal St
- 230 S Walden Elms Cir
- 101 N Villa Oaks Dr
- 27 Medley Ln
- 26 N Walden Elms Cir
- 27 S Belfair Place
- 85 Summer Lark Place
- 35 N Walden Elms Cir
- 7 Verbena Bend Place
- 78 N Walden Elms Cir
- 6 Tethered Vine Place
- 253 Palomino Ct
- 128 Caspian Way
- 15 Mulberry Glen Place
- 9 Mulberry Glen Place
- 19 Mulberry Glen Place
- 7 Mulberry Glen Place
- 22 Paddock Pines Place
- 18 Paddock Pines Place
- 26 Paddock Pines Place
- 14 Paddock Pines Place
- 23 Mulberry Glen Place
- 3 Mulberry Glen Place
- 10 Paddock Pines Place
- 30 Paddock Pines Place
- 10 Mulberry Glen Place
- 6 Paddock Pines Place
- 6 Mulberry Glen Place
- 18 Mulberry Glen Place
- 27 Mulberry Glen Place
- 34 Paddock Pines Place
- 2 Mulberry Glen Place
- 22 Mulberry Glen Place