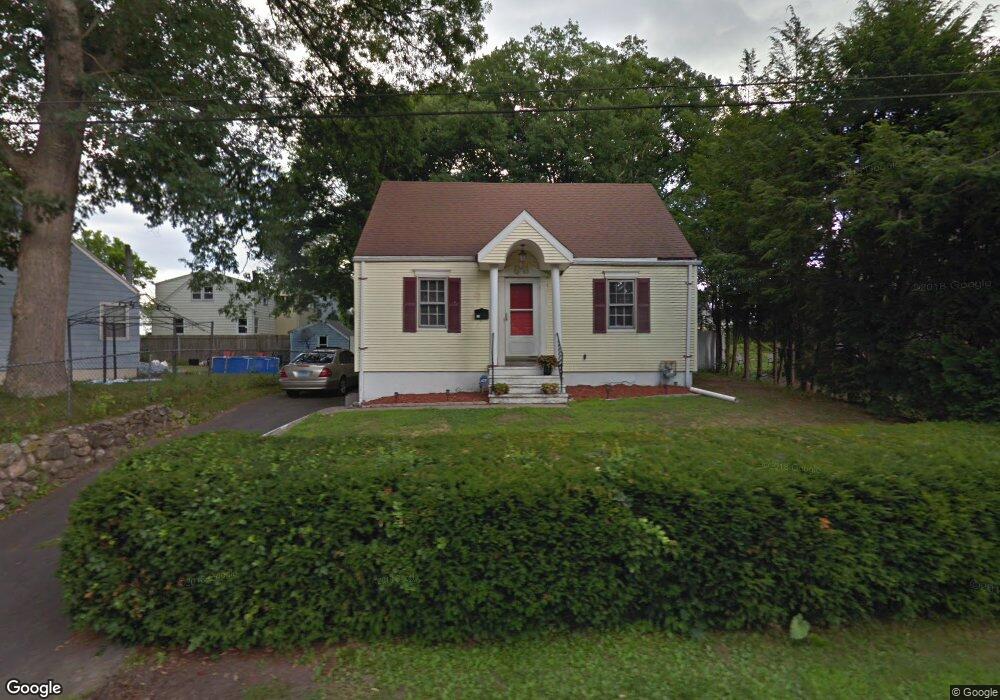
11 Myrna Ave Waterbury, CT 06704
North End District NeighborhoodEstimated Value: $251,000 - $300,000
4
Beds
2
Baths
1,234
Sq Ft
$221/Sq Ft
Est. Value
About This Home
This home is located at 11 Myrna Ave, Waterbury, CT 06704 and is currently estimated at $273,140, approximately $221 per square foot. 11 Myrna Ave is a home located in New Haven County with nearby schools including F. J. Kingsbury School, North End Middle School, and Wilby High School.
Ownership History
Date
Name
Owned For
Owner Type
Purchase Details
Closed on
Oct 22, 2007
Sold by
Ludo Magda
Bought by
Washington Eric L and Leach Monique J
Current Estimated Value
Home Financials for this Owner
Home Financials are based on the most recent Mortgage that was taken out on this home.
Original Mortgage
$143,700
Outstanding Balance
$91,116
Interest Rate
6.51%
Mortgage Type
Purchase Money Mortgage
Estimated Equity
$182,024
Purchase Details
Closed on
Jun 15, 2007
Sold by
Diaz Anthony
Bought by
Lugo Magda
Purchase Details
Closed on
Feb 4, 2000
Sold by
Ammerman Mark and Ammerman Darlene
Bought by
Diaz Anthony
Home Financials for this Owner
Home Financials are based on the most recent Mortgage that was taken out on this home.
Original Mortgage
$87,755
Interest Rate
7.91%
Mortgage Type
Purchase Money Mortgage
Purchase Details
Closed on
Aug 9, 1991
Sold by
Flaherty Virginia M
Bought by
Ammerman Mark and Ammerman Darlene
Create a Home Valuation Report for This Property
The Home Valuation Report is an in-depth analysis detailing your home's value as well as a comparison with similar homes in the area
Home Values in the Area
Average Home Value in this Area
Purchase History
| Date | Buyer | Sale Price | Title Company |
|---|---|---|---|
| Washington Eric L | $144,900 | -- | |
| Lugo Magda | $112,000 | -- | |
| Diaz Anthony | $87,800 | -- | |
| Ammerman Mark | $85,000 | -- |
Source: Public Records
Mortgage History
| Date | Status | Borrower | Loan Amount |
|---|---|---|---|
| Open | Ammerman Mark | $143,700 | |
| Closed | Ammerman Mark | $10,700 | |
| Previous Owner | Ammerman Mark | $87,755 | |
| Previous Owner | Ammerman Mark | $80,941 |
Source: Public Records
Tax History Compared to Growth
Tax History
| Year | Tax Paid | Tax Assessment Tax Assessment Total Assessment is a certain percentage of the fair market value that is determined by local assessors to be the total taxable value of land and additions on the property. | Land | Improvement |
|---|---|---|---|---|
| 2025 | $4,783 | $106,330 | $19,670 | $86,660 |
| 2024 | $5,257 | $106,330 | $19,670 | $86,660 |
| 2023 | $5,762 | $106,330 | $19,670 | $86,660 |
| 2022 | $3,889 | $64,590 | $19,660 | $44,930 |
| 2021 | $3,889 | $64,590 | $19,660 | $44,930 |
| 2020 | $3,889 | $64,590 | $19,660 | $44,930 |
| 2019 | $3,889 | $64,590 | $19,660 | $44,930 |
| 2018 | $3,889 | $64,590 | $19,660 | $44,930 |
| 2017 | $4,188 | $69,560 | $19,660 | $49,900 |
| 2016 | $4,188 | $69,560 | $19,660 | $49,900 |
| 2015 | $4,050 | $69,560 | $19,660 | $49,900 |
| 2014 | $4,050 | $69,560 | $19,660 | $49,900 |
Source: Public Records
Map
Nearby Homes