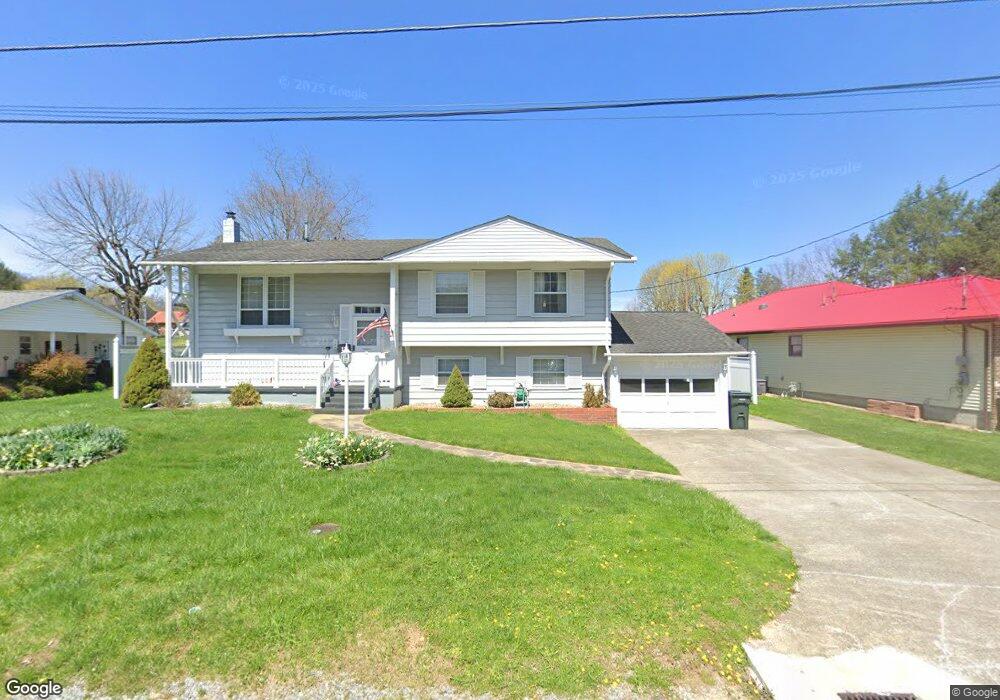
11 Myrna St Buckhannon, WV 26201
Estimated Value: $149,000 - $240,000
4
Beds
2
Baths
1,100
Sq Ft
$178/Sq Ft
Est. Value
About This Home
This home is located at 11 Myrna St, Buckhannon, WV 26201 and is currently estimated at $195,434, approximately $177 per square foot. 11 Myrna St is a home located in Upshur County with nearby schools including Buckhannon Upshur High School, Brushy Fork Christian School, and Upshur County Christian Academy.
Ownership History
Date
Name
Owned For
Owner Type
Purchase Details
Closed on
Feb 28, 2024
Sold by
Margaret E Blend Irrevocable Trust and Blend Bruce E
Bought by
Crum Logan Charles
Current Estimated Value
Home Financials for this Owner
Home Financials are based on the most recent Mortgage that was taken out on this home.
Original Mortgage
$197,000
Interest Rate
6.94%
Mortgage Type
New Conventional
Purchase Details
Closed on
Dec 1, 2014
Sold by
Theodore Theodore and Blend Margaret E
Bought by
Blend Margaret E
Create a Home Valuation Report for This Property
The Home Valuation Report is an in-depth analysis detailing your home's value as well as a comparison with similar homes in the area
Home Values in the Area
Average Home Value in this Area
Purchase History
| Date | Buyer | Sale Price | Title Company |
|---|---|---|---|
| Crum Logan Charles | $217,000 | None Listed On Document | |
| Blend Margaret E | $56,450 | -- |
Source: Public Records
Mortgage History
| Date | Status | Borrower | Loan Amount |
|---|---|---|---|
| Previous Owner | Crum Logan Charles | $197,000 |
Source: Public Records
Tax History Compared to Growth
Tax History
| Year | Tax Paid | Tax Assessment Tax Assessment Total Assessment is a certain percentage of the fair market value that is determined by local assessors to be the total taxable value of land and additions on the property. | Land | Improvement |
|---|---|---|---|---|
| 2024 | $766 | $80,460 | $19,800 | $60,660 |
| 2023 | $580 | $76,680 | $19,680 | $57,000 |
| 2022 | $658 | $76,920 | $19,680 | $57,240 |
| 2021 | $640 | $75,420 | $19,680 | $55,740 |
| 2020 | $632 | $74,700 | $19,680 | $55,020 |
| 2019 | $602 | $72,120 | $17,700 | $54,420 |
| 2018 | $613 | $73,020 | $17,700 | $55,320 |
| 2017 | $606 | $72,420 | $17,700 | $54,720 |
| 2016 | $592 | $71,220 | $17,700 | $53,520 |
| 2015 | $584 | $70,620 | $17,700 | $52,920 |
| 2014 | $552 | $67,740 | $16,980 | $50,760 |
Source: Public Records
Map
Nearby Homes