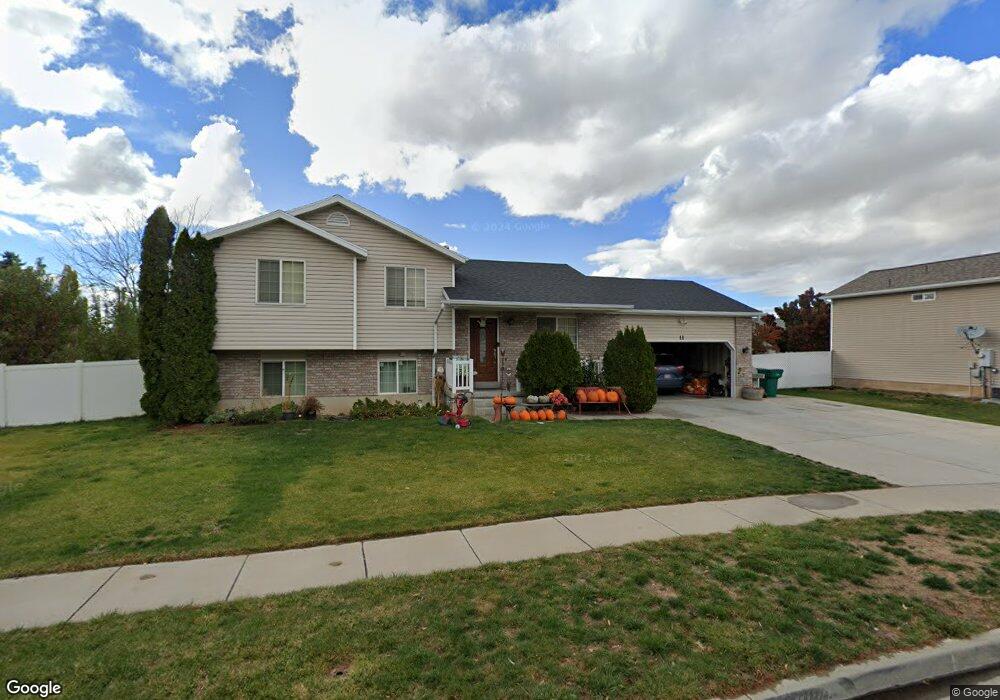
11 N 975 W Layton, UT 84041
Estimated Value: $469,000 - $544,000
4
Beds
3
Baths
2,065
Sq Ft
$245/Sq Ft
Est. Value
About This Home
This home is located at 11 N 975 W, Layton, UT 84041 and is currently estimated at $506,179, approximately $245 per square foot. 11 N 975 W is a home located in Davis County with nearby schools including Layton Elementary School, Fairfield Junior High School, and Layton High School.
Ownership History
Date
Name
Owned For
Owner Type
Purchase Details
Closed on
Sep 3, 2002
Sold by
Hallmark Homes & Development
Bought by
Sandoval Reynaldo and Magana Francisco
Current Estimated Value
Home Financials for this Owner
Home Financials are based on the most recent Mortgage that was taken out on this home.
Original Mortgage
$150,143
Outstanding Balance
$62,350
Interest Rate
6.29%
Mortgage Type
FHA
Estimated Equity
$443,829
Purchase Details
Closed on
Aug 30, 2002
Sold by
Sandoval Reynaldo
Bought by
Magana Francisco
Home Financials for this Owner
Home Financials are based on the most recent Mortgage that was taken out on this home.
Original Mortgage
$150,143
Outstanding Balance
$62,350
Interest Rate
6.29%
Mortgage Type
FHA
Estimated Equity
$443,829
Create a Home Valuation Report for This Property
The Home Valuation Report is an in-depth analysis detailing your home's value as well as a comparison with similar homes in the area
Home Values in the Area
Average Home Value in this Area
Purchase History
| Date | Buyer | Sale Price | Title Company |
|---|---|---|---|
| Sandoval Reynaldo | -- | Backman Stewart Title Svcs | |
| Magana Francisco | -- | Backman Stewart Title Svcs |
Source: Public Records
Mortgage History
| Date | Status | Borrower | Loan Amount |
|---|---|---|---|
| Open | Sandoval Reynaldo | $150,143 |
Source: Public Records
Tax History Compared to Growth
Tax History
| Year | Tax Paid | Tax Assessment Tax Assessment Total Assessment is a certain percentage of the fair market value that is determined by local assessors to be the total taxable value of land and additions on the property. | Land | Improvement |
|---|---|---|---|---|
| 2025 | -- | $244,200 | $106,011 | $138,189 |
| 2024 | -- | $237,600 | $117,133 | $120,467 |
| 2023 | $2,237 | $417,000 | $116,173 | $300,827 |
| 2022 | $2,424 | $245,300 | $72,471 | $172,829 |
| 2021 | $0 | $341,000 | $108,729 | $232,271 |
| 2020 | $2,044 | $296,000 | $91,501 | $204,499 |
| 2019 | $2,009 | $285,000 | $93,948 | $191,052 |
| 2018 | $1,819 | $259,000 | $82,392 | $176,608 |
| 2016 | $1,582 | $116,215 | $32,336 | $83,879 |
| 2015 | $1,450 | $101,145 | $32,336 | $68,809 |
| 2014 | $1,407 | $100,296 | $32,336 | $67,960 |
| 2013 | -- | $103,689 | $28,952 | $74,737 |
Source: Public Records
Map
Nearby Homes
- 933 W Gentile St
- 65 Ronald Ave
- 750 W Gentile St
- 296 S 950 W
- 362 S 950 W
- 485 W 100 N
- Browning Plan at Amber Fields
- Rhapsody Plan at Amber Fields
- Accord Plan at Amber Fields
- Timpani Plan at Amber Fields
- Octave Plan at Amber Fields
- Tempo Plan at Amber Fields
- Harvard Plan at Amber Fields
- Fortissimo Plan at Amber Fields
- Forte Plan at Amber Fields
- Interlude Plan at Amber Fields
- Concerto Plan at Amber Fields
- Bravo Plan at Amber Fields
- Capitol Plan at Amber Fields
- Anthem Plan at Amber Fields