Estimated Value: $286,000 - $294,000
3
Beds
3
Baths
1,853
Sq Ft
$156/Sq Ft
Est. Value
About This Home
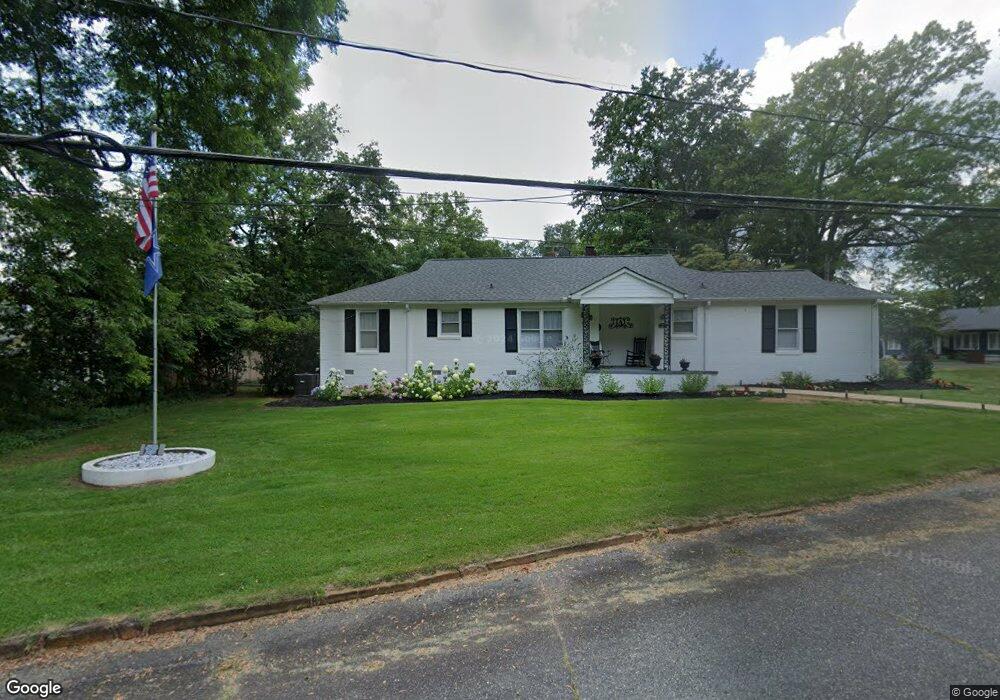
This home is located at 11 N Humphrey St, Inman, SC 29349 and is currently estimated at $289,575, approximately $156 per square foot. 11 N Humphrey St is a home with nearby schools including Inman Elementary School, T.E. Mabry Middle School, and Chapman High School.
Ownership History
Date
Name
Owned For
Owner Type
Purchase Details
Closed on
Nov 4, 2022
Sold by
Tamir Llc
Bought by
Abernathy Amanda Gibson and Abernathy Richard W
Current Estimated Value
Home Financials for this Owner
Home Financials are based on the most recent Mortgage that was taken out on this home.
Original Mortgage
$264,127
Outstanding Balance
$255,555
Interest Rate
6.7%
Mortgage Type
Balloon
Estimated Equity
$34,020
Purchase Details
Closed on
Jul 14, 2022
Sold by
Gil Innovations Llc
Bought by
Tamir Llc
Purchase Details
Closed on
Sep 22, 2021
Sold by
Morrow Ginger F and Morrow Hilda H
Bought by
Gil Innovations Llc
Purchase Details
Closed on
Aug 6, 2009
Sold by
Morrow J Lawrence
Bought by
Morrow Ginger F
Create a Home Valuation Report for This Property
The Home Valuation Report is an in-depth analysis detailing your home's value as well as a comparison with similar homes in the area
Home Values in the Area
Average Home Value in this Area
Purchase History
| Date | Buyer | Sale Price | Title Company |
|---|---|---|---|
| Abernathy Amanda Gibson | $269,000 | -- | |
| Abernathy Amanda Gibson | $269,000 | -- | |
| Tamir Llc | -- | None Listed On Document | |
| Tamir Llc | -- | None Listed On Document | |
| Gil Innovations Llc | $130,000 | None Available | |
| Morrow Ginger F | -- | -- |
Source: Public Records
Mortgage History
| Date | Status | Borrower | Loan Amount |
|---|---|---|---|
| Open | Abernathy Amanda Gibson | $264,127 | |
| Closed | Abernathy Amanda Gibson | $264,127 |
Source: Public Records
Tax History Compared to Growth
Tax History
| Year | Tax Paid | Tax Assessment Tax Assessment Total Assessment is a certain percentage of the fair market value that is determined by local assessors to be the total taxable value of land and additions on the property. | Land | Improvement |
|---|---|---|---|---|
| 2025 | $2,668 | $10,760 | $604 | $10,156 |
| 2024 | $2,668 | $10,760 | $604 | $10,156 |
| 2023 | $2,668 | $10,760 | $604 | $10,156 |
| 2022 | $5,331 | $11,106 | $600 | $10,506 |
| 2021 | $1,608 | $6,583 | $356 | $6,227 |
| 2020 | $1,572 | $6,583 | $356 | $6,227 |
| 2019 | $1,592 | $6,583 | $356 | $6,227 |
| 2018 | $1,572 | $6,583 | $356 | $6,227 |
| 2017 | $1,334 | $5,724 | $400 | $5,324 |
| 2016 | $1,292 | $5,724 | $400 | $5,324 |
| 2015 | $1,287 | $5,724 | $400 | $5,324 |
| 2014 | $1,244 | $5,724 | $400 | $5,324 |
Source: Public Records
Map
Nearby Homes