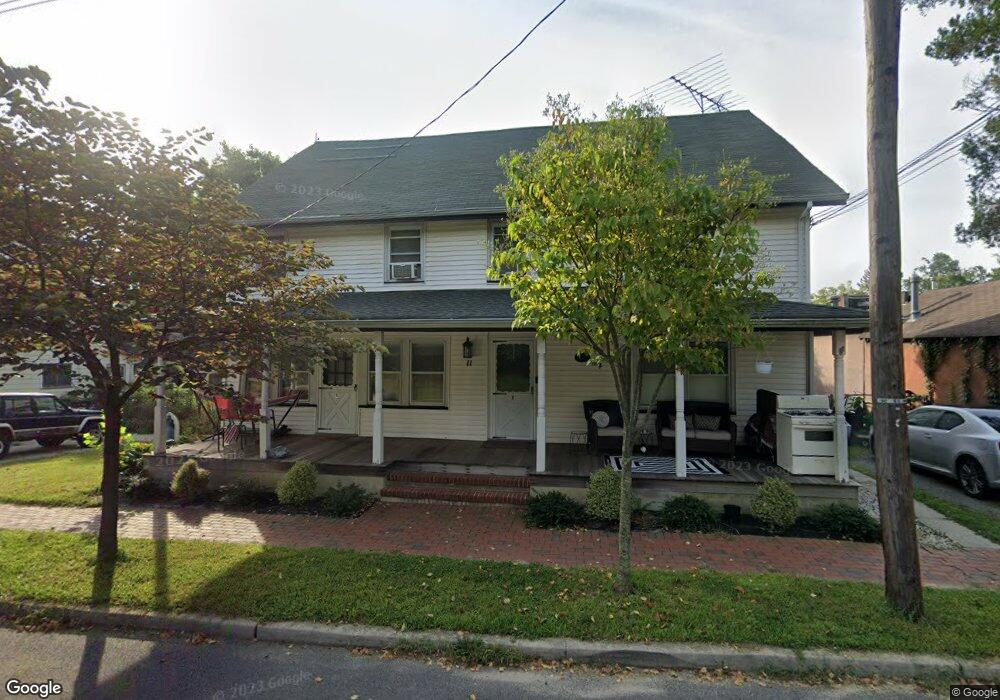
11 N Main St Windsor, NJ 08561
Estimated Value: $563,663 - $862,000
--
Bed
--
Bath
3,096
Sq Ft
$224/Sq Ft
Est. Value
About This Home
This home is located at 11 N Main St, Windsor, NJ 08561 and is currently estimated at $694,666, approximately $224 per square foot. 11 N Main St is a home with nearby schools including Sharon Elementary School, Pond Road Middle School, and Robbinsville High School.
Ownership History
Date
Name
Owned For
Owner Type
Purchase Details
Closed on
Jan 25, 2017
Sold by
Mynick Paul and Hovemeyer Lisa
Bought by
Johnson Jared M and Johnson Kendall E
Current Estimated Value
Home Financials for this Owner
Home Financials are based on the most recent Mortgage that was taken out on this home.
Original Mortgage
$376,475
Interest Rate
4.1%
Mortgage Type
FHA
Purchase Details
Closed on
Feb 21, 2014
Sold by
Nymick Paul and Hovemeyer Lisa
Bought by
Nymick Paul and Hovemeyer Lisa
Purchase Details
Closed on
Jul 30, 2010
Sold by
Nymick Paul and Hovemeyer Lisa
Bought by
Nymick Paul and Hovemeyer Lisa
Purchase Details
Closed on
Dec 8, 2006
Sold by
Hovemeyer Lisa
Bought by
Hovemeyer Nymick Jr Paul and Hovemeyer Lisa
Home Financials for this Owner
Home Financials are based on the most recent Mortgage that was taken out on this home.
Original Mortgage
$90,000
Interest Rate
6.24%
Mortgage Type
Purchase Money Mortgage
Create a Home Valuation Report for This Property
The Home Valuation Report is an in-depth analysis detailing your home's value as well as a comparison with similar homes in the area
Home Values in the Area
Average Home Value in this Area
Purchase History
| Date | Buyer | Sale Price | Title Company |
|---|---|---|---|
| Johnson Jared M | $400,000 | None Available | |
| Nymick Paul | -- | None Available | |
| Nymick Paul | -- | None Available | |
| Hovemeyer Nymick Jr Paul | $385,000 | -- |
Source: Public Records
Mortgage History
| Date | Status | Borrower | Loan Amount |
|---|---|---|---|
| Previous Owner | Johnson Jared M | $376,475 | |
| Previous Owner | Hovemeyer Nymick Jr Paul | $90,000 |
Source: Public Records
Tax History Compared to Growth
Tax History
| Year | Tax Paid | Tax Assessment Tax Assessment Total Assessment is a certain percentage of the fair market value that is determined by local assessors to be the total taxable value of land and additions on the property. | Land | Improvement |
|---|---|---|---|---|
| 2025 | $10,611 | $317,500 | $110,000 | $207,500 |
| 2024 | $9,903 | $317,500 | $110,000 | $207,500 |
| 2023 | $9,903 | $317,500 | $110,000 | $207,500 |
| 2022 | $9,519 | $317,500 | $110,000 | $207,500 |
| 2021 | $9,382 | $317,500 | $110,000 | $207,500 |
| 2020 | $9,385 | $317,500 | $110,000 | $207,500 |
| 2019 | $9,388 | $317,500 | $110,000 | $207,500 |
| 2018 | $9,328 | $317,500 | $110,000 | $207,500 |
| 2017 | $9,309 | $317,500 | $110,000 | $207,500 |
| 2016 | $9,223 | $317,500 | $110,000 | $207,500 |
| 2015 | $9,084 | $317,500 | $110,000 | $207,500 |
| 2014 | $9,115 | $317,500 | $110,000 | $207,500 |
Source: Public Records
Map
Nearby Homes
- 23 N Main St
- 1305 1325 Route 130
- 45 Bennet Field Way
- 51 Bennet Field Way
- Hampton Plan at Preston Pointe
- 47 Bennet Field Way
- 53 Bennet Field Way
- 32 Bennet Field Way
- 43 Bennet Field Way
- 49 Bennet Field Way
- 38 Bennet Field Way
- Chadwick Plan at Preston Pointe
- 55 Bennet Field Way
- 34 Bennet Field Way
- 57 Bennet Field Way
- 299 Perrineville Rd
- 94 Tindall Rd
- 260 Gordon Rd
- 17 Howard Dr
- 116 Hankins Rd
- 11 N Main St Unit C
- 11 N Main St Unit D
- 11 N Main St
- 11 N Main St Unit C
- 11 N Main St Unit D
- 11 N Main St Unit B
- 13 N Main St
- 29 Church St
- 25 Church St
- 10 N Main St
- 11 School Dr
- 33 Church St
- 23 Church St
- 23 Church St Unit A&B
- 23 Church St Unit A
- 15 School Dr
- 19 Church St
- 17 School Dr
- 35 Church St
- 35 Church St