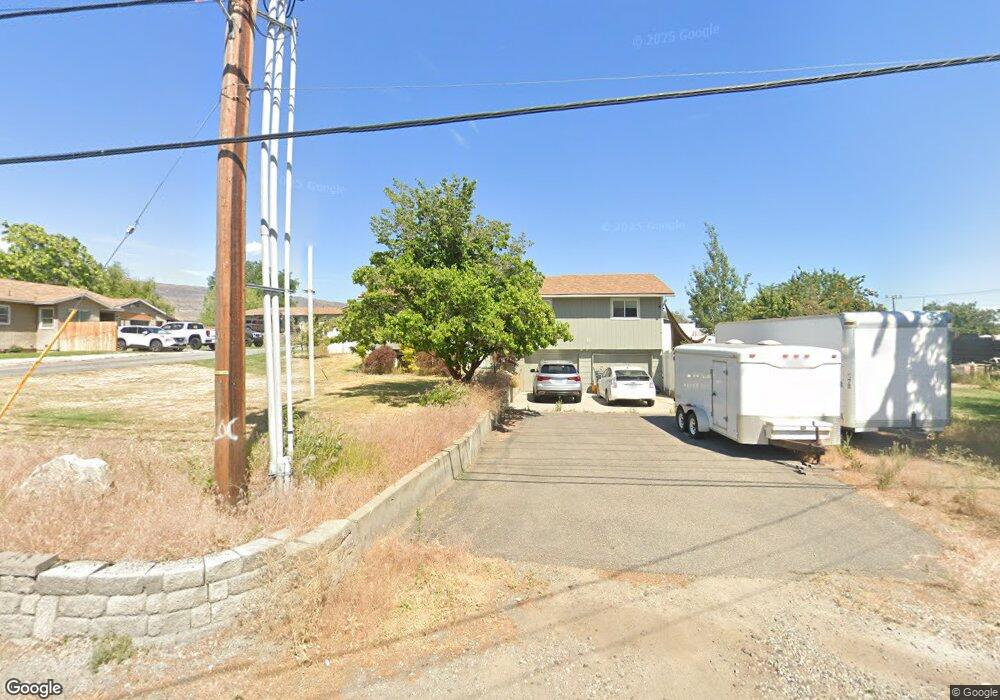
11 N Nile Ave East Wenatchee, WA 98802
Estimated Value: $369,000 - $534,000
3
Beds
2
Baths
2,011
Sq Ft
$235/Sq Ft
Est. Value
About This Home
This home is located at 11 N Nile Ave, East Wenatchee, WA 98802 and is currently estimated at $472,758, approximately $235 per square foot. 11 N Nile Ave is a home located in Douglas County with nearby schools including Grant Elementary School, Clovis Point Intermediate School, and Kenroy Elementary School.
Ownership History
Date
Name
Owned For
Owner Type
Purchase Details
Closed on
Jan 6, 2017
Sold by
Elliott Robert
Bought by
Elliott Linda M
Current Estimated Value
Home Financials for this Owner
Home Financials are based on the most recent Mortgage that was taken out on this home.
Original Mortgage
$278,910
Outstanding Balance
$229,584
Interest Rate
4.08%
Mortgage Type
New Conventional
Estimated Equity
$243,174
Create a Home Valuation Report for This Property
The Home Valuation Report is an in-depth analysis detailing your home's value as well as a comparison with similar homes in the area
Home Values in the Area
Average Home Value in this Area
Purchase History
| Date | Buyer | Sale Price | Title Company |
|---|---|---|---|
| Elliott Linda M | -- | First American Title Ins Co | |
| Elliott Linda M | $309,900 | First American Title Ins Co |
Source: Public Records
Mortgage History
| Date | Status | Borrower | Loan Amount |
|---|---|---|---|
| Open | Elliott Linda M | $278,910 |
Source: Public Records
Tax History Compared to Growth
Tax History
| Year | Tax Paid | Tax Assessment Tax Assessment Total Assessment is a certain percentage of the fair market value that is determined by local assessors to be the total taxable value of land and additions on the property. | Land | Improvement |
|---|---|---|---|---|
| 2025 | $400 | $407,400 | $100,000 | $307,400 |
| 2024 | $3,727 | $390,100 | $100,000 | $290,100 |
| 2023 | $4,026 | $364,400 | $100,000 | $264,400 |
| 2022 | $3,690 | $316,300 | $80,000 | $236,300 |
| 2021 | $3,881 | $316,300 | $80,000 | $236,300 |
| 2020 | $3,799 | $308,300 | $72,000 | $236,300 |
| 2018 | $3,432 | $272,500 | $60,000 | $212,500 |
| 2017 | $3,031 | $272,500 | $60,000 | $212,500 |
| 2016 | $2,684 | $258,900 | $60,000 | $198,900 |
| 2015 | $2,565 | $236,100 | $60,000 | $176,100 |
| 2014 | -- | $216,400 | $60,000 | $156,400 |
| 2013 | -- | $211,800 | $60,000 | $151,800 |
Source: Public Records
Map
Nearby Homes
- 2515 1st St SE
- 2575 1st St SE
- 2526 1st St SE
- 2425 Noah St SE
- 2460 Noah St SE
- 2368 2nd St SE
- 2350 2nd St SE
- 2340 2nd St SE
- 2322 2nd St SE
- 0 N Quincy Ave
- 2223 Maryhill St SE
- 530 Sunday Dr
- 2202 Maryhill St SE
- 565 Sunday Dr
- 39 Mandolin Ave
- 2545 6th St SE
- 584 Canyon Dr
- 581 S Oasis Loop
- 2716 8th St NE
- 3110 1st St SE