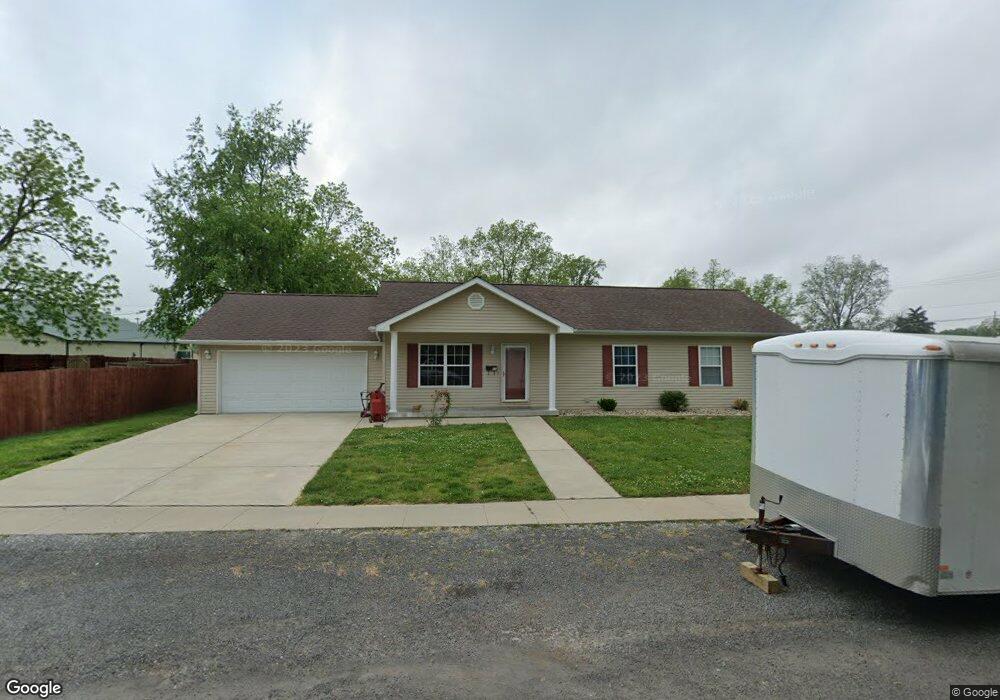
11 N Richland St Freeburg, IL 62243
Estimated Value: $176,000 - $227,000
--
Bed
--
Bath
1,250
Sq Ft
$163/Sq Ft
Est. Value
About This Home
This home is located at 11 N Richland St, Freeburg, IL 62243 and is currently estimated at $203,226, approximately $162 per square foot. 11 N Richland St is a home located in St. Clair County with nearby schools including Freeburg Elementary School, Freeburg Community High School, and St. Joseph Catholic School.
Ownership History
Date
Name
Owned For
Owner Type
Purchase Details
Closed on
Jul 8, 2022
Sold by
Private Sales Corp
Bought by
Ambassadors Development Llc
Current Estimated Value
Purchase Details
Closed on
May 23, 2006
Sold by
Jennings David L and Jennings Colleen A
Bought by
Davis Ladonna E
Home Financials for this Owner
Home Financials are based on the most recent Mortgage that was taken out on this home.
Original Mortgage
$100,000
Interest Rate
6.56%
Mortgage Type
Fannie Mae Freddie Mac
Purchase Details
Closed on
Sep 19, 2001
Sold by
Citizens Community Bank
Bought by
Jennings David L and Jennings Colleen A
Home Financials for this Owner
Home Financials are based on the most recent Mortgage that was taken out on this home.
Original Mortgage
$47,938
Interest Rate
7.06%
Mortgage Type
Seller Take Back
Create a Home Valuation Report for This Property
The Home Valuation Report is an in-depth analysis detailing your home's value as well as a comparison with similar homes in the area
Home Values in the Area
Average Home Value in this Area
Purchase History
| Date | Buyer | Sale Price | Title Company |
|---|---|---|---|
| Ambassadors Development Llc | $130,500 | None Available | |
| Davis Ladonna E | $149,500 | Town & Country Title Co | |
| Jennings David L | $53,000 | Chicago Title |
Source: Public Records
Mortgage History
| Date | Status | Borrower | Loan Amount |
|---|---|---|---|
| Previous Owner | Davis Ladonna E | $100,000 | |
| Previous Owner | Jennings David L | $47,938 |
Source: Public Records
Tax History Compared to Growth
Tax History
| Year | Tax Paid | Tax Assessment Tax Assessment Total Assessment is a certain percentage of the fair market value that is determined by local assessors to be the total taxable value of land and additions on the property. | Land | Improvement |
|---|---|---|---|---|
| 2024 | $4,746 | $56,762 | $8,660 | $48,102 |
| 2023 | $4,631 | $54,615 | $8,357 | $46,258 |
| 2022 | $4,435 | $51,176 | $7,831 | $43,345 |
| 2021 | $3,761 | $48,179 | $7,372 | $40,807 |
| 2020 | $3,564 | $43,831 | $6,707 | $37,124 |
| 2019 | $3,604 | $46,140 | $6,934 | $39,206 |
| 2018 | $3,537 | $45,530 | $6,842 | $38,688 |
| 2017 | $3,364 | $43,531 | $6,541 | $36,990 |
| 2016 | $3,319 | $41,720 | $6,269 | $35,451 |
| 2014 | $1,507 | $42,811 | $6,433 | $36,378 |
| 2013 | $3,298 | $42,430 | $6,376 | $36,054 |
Source: Public Records
Map
Nearby Homes
- 312 W Phillips St
- 206 N Main St
- 302 N Railroad St
- 207 N Edison St
- 401 N Edison St
- 106 S Vine St
- 520 N Edison St
- 420 Foxtail Dr
- 440 Foxtail Dr
- 3 Park St
- 433 Foxtail Dr
- 304 Torrington Ln
- 359 Sleeping Indian Dr
- 363 Sleeping Indian Dr
- 222 Alamosa Dr
- 103 Draco Dr
- 227 Alamosa Dr
- 0 Hickory Dr
- 109 Willow Dr
- 111 Willow Dr